

May 31, 2026 | Market Reports
Real Estate Market Update | May 2026

May is typically one of the busiest months of the year in the North of Boston market, and 2026 delivered active numbers across all three towns. Winchester saw its largest volume surge of the spring, Lexington posted an unusual result with sales counts landing in exactly the same spot as a year ago, and Arlington continued a run of above-asking-price competition that has defined its spring market. Here is the full breakdown.
Winchester
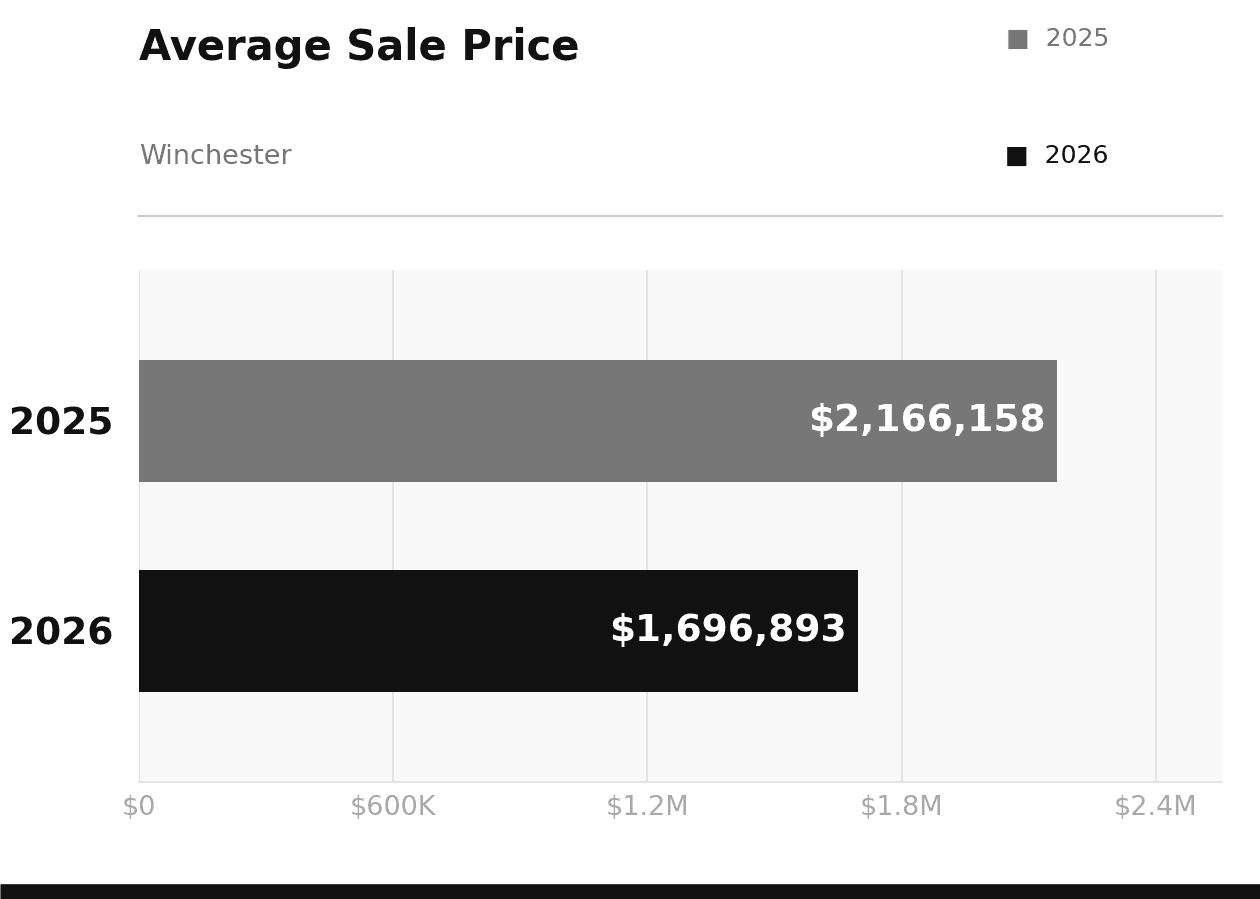
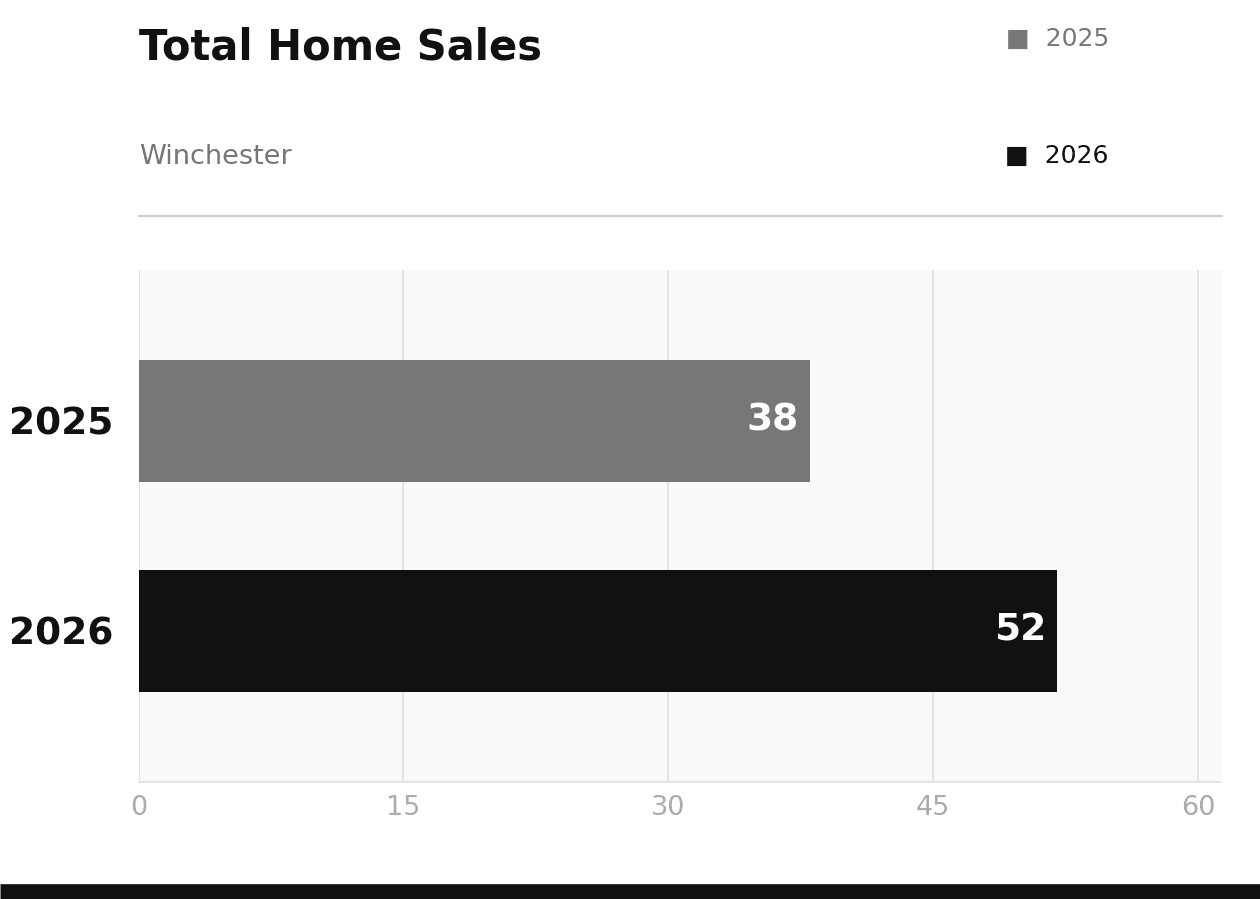
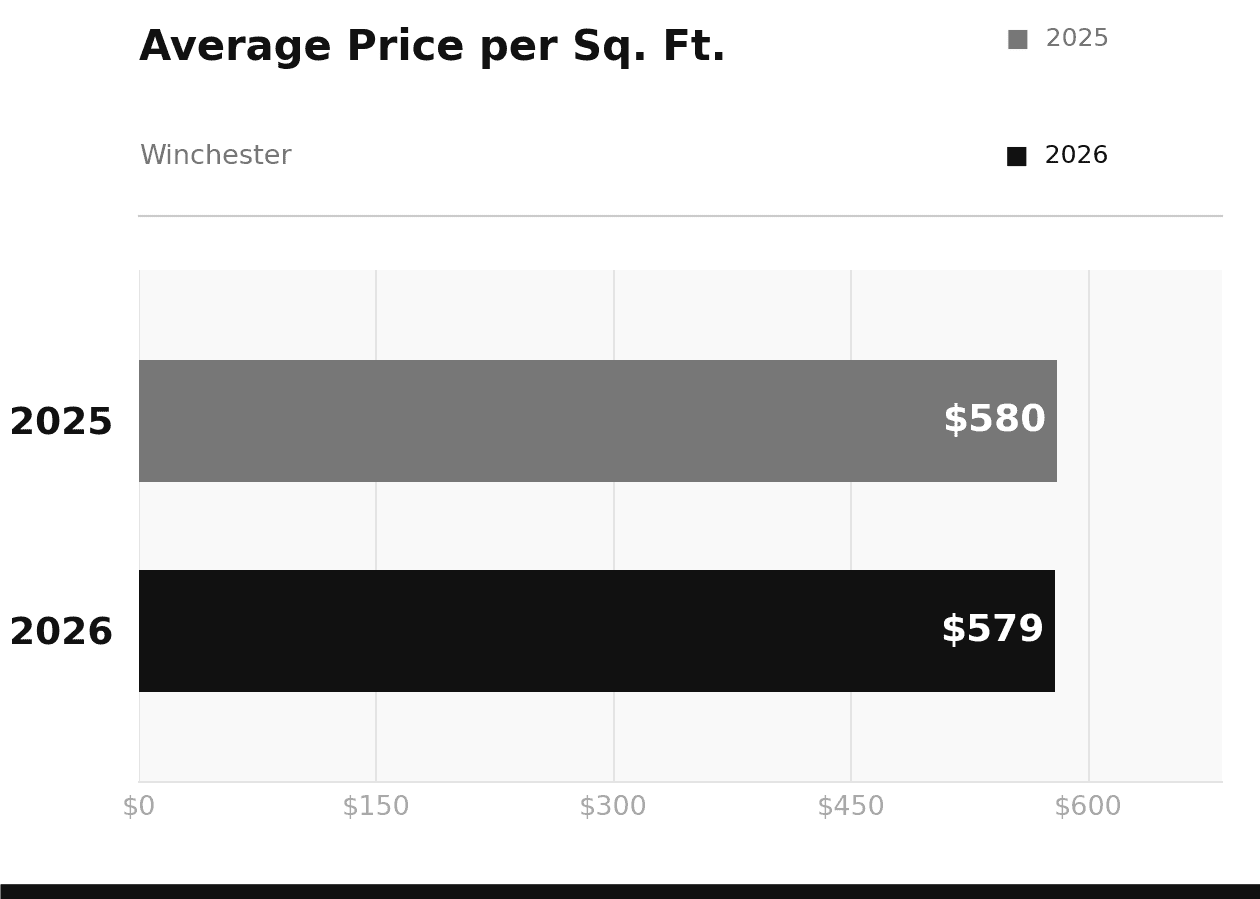
Winchester had its strongest month of the spring in May, with 52 homes closing compared to 38 in May 2025, a 37% jump in volume. Average sale price came in at $1,696,893 versus $2,166,158 a year ago, but price per square foot dropped by just $1, from $580 to $579. That near-identical per-foot figure confirms the average price gap is a mix story: more mid-range homes closed this May relative to last year, which pulled the average down without reflecting any real decline in what Winchester homes are worth per square foot.
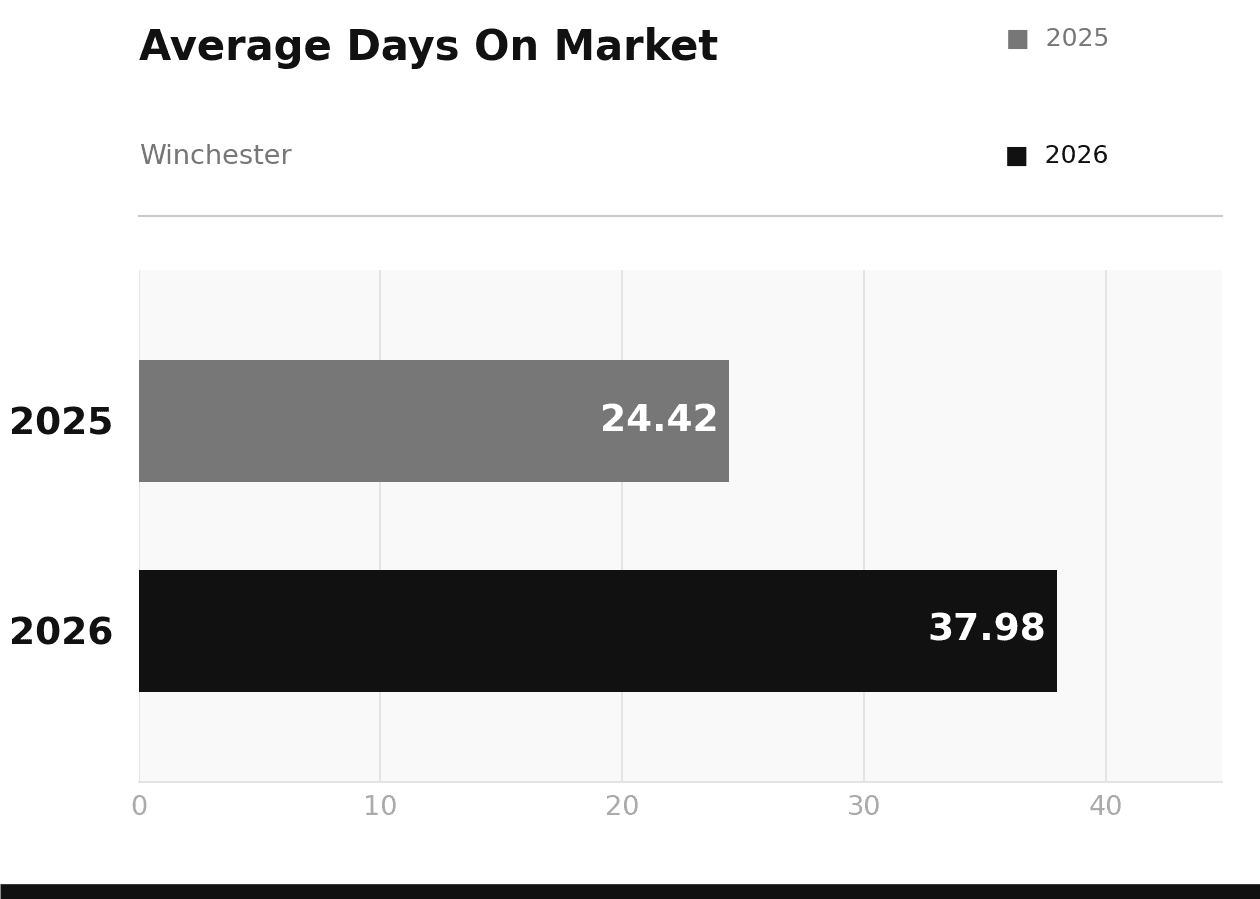
Days on market stretched from about 24 days in May 2025 to just under 38 in May 2026. Homes are taking a bit longer to go under agreement than last spring, which means sellers need to price thoughtfully rather than expecting the frenzied pace of prior years. But with 52 closings, demand was clearly present.
Lexington
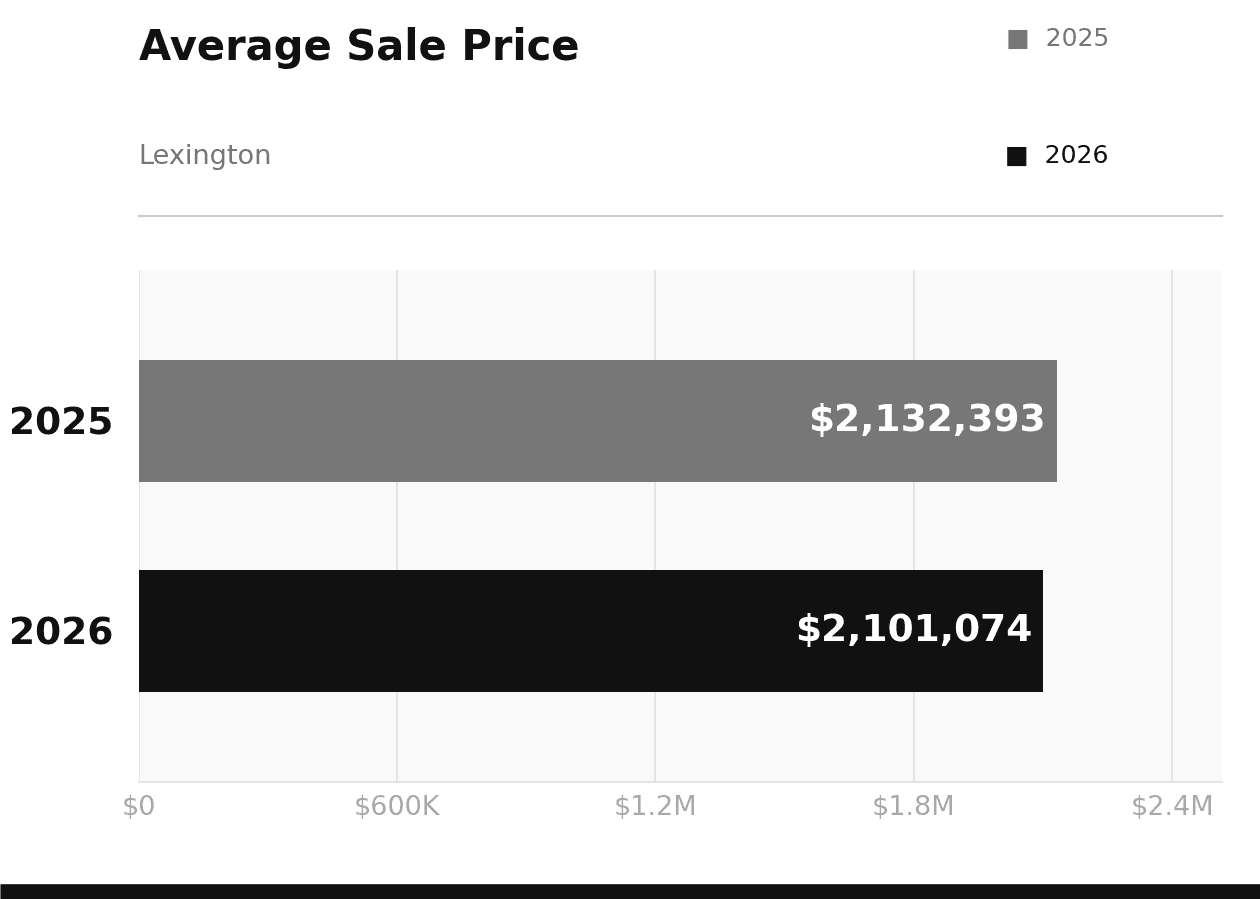
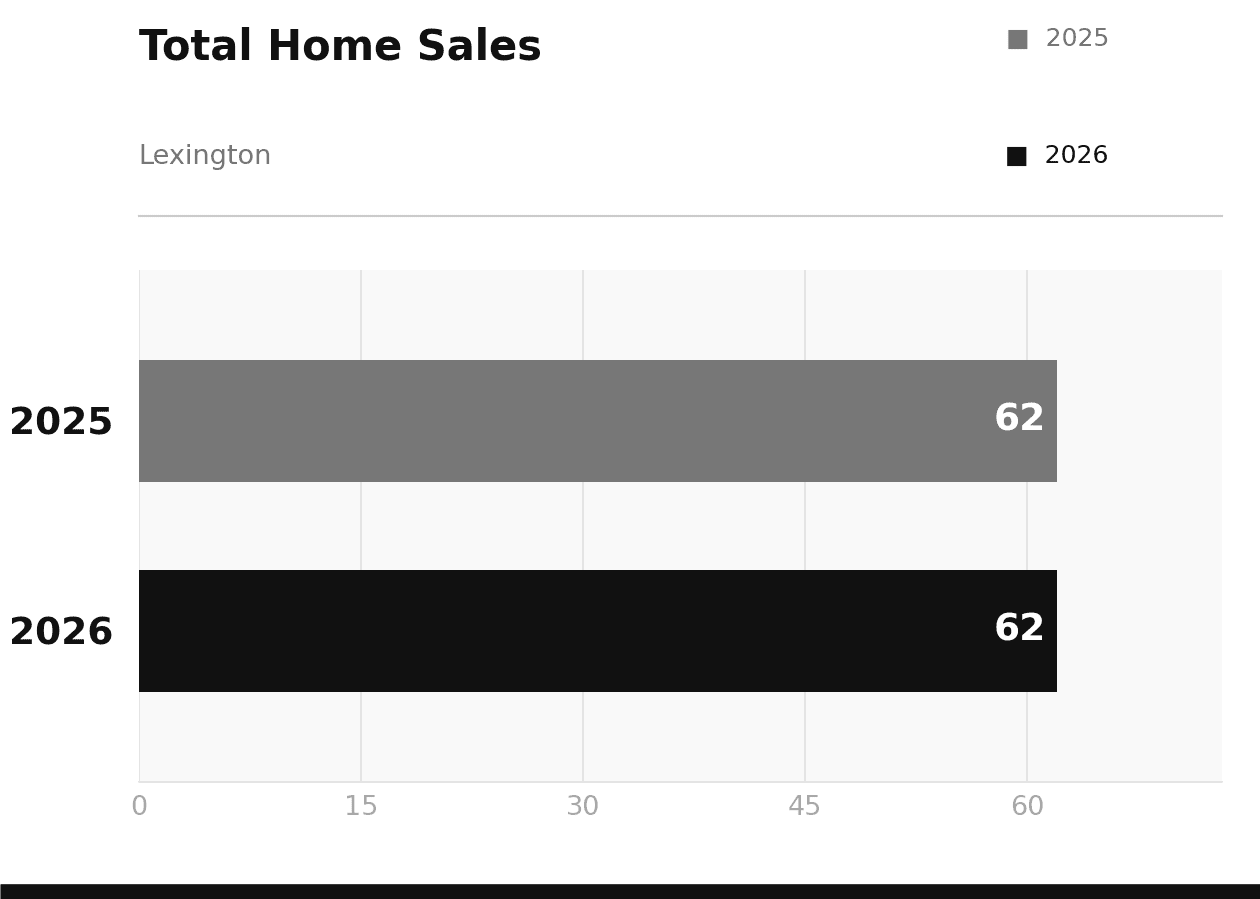
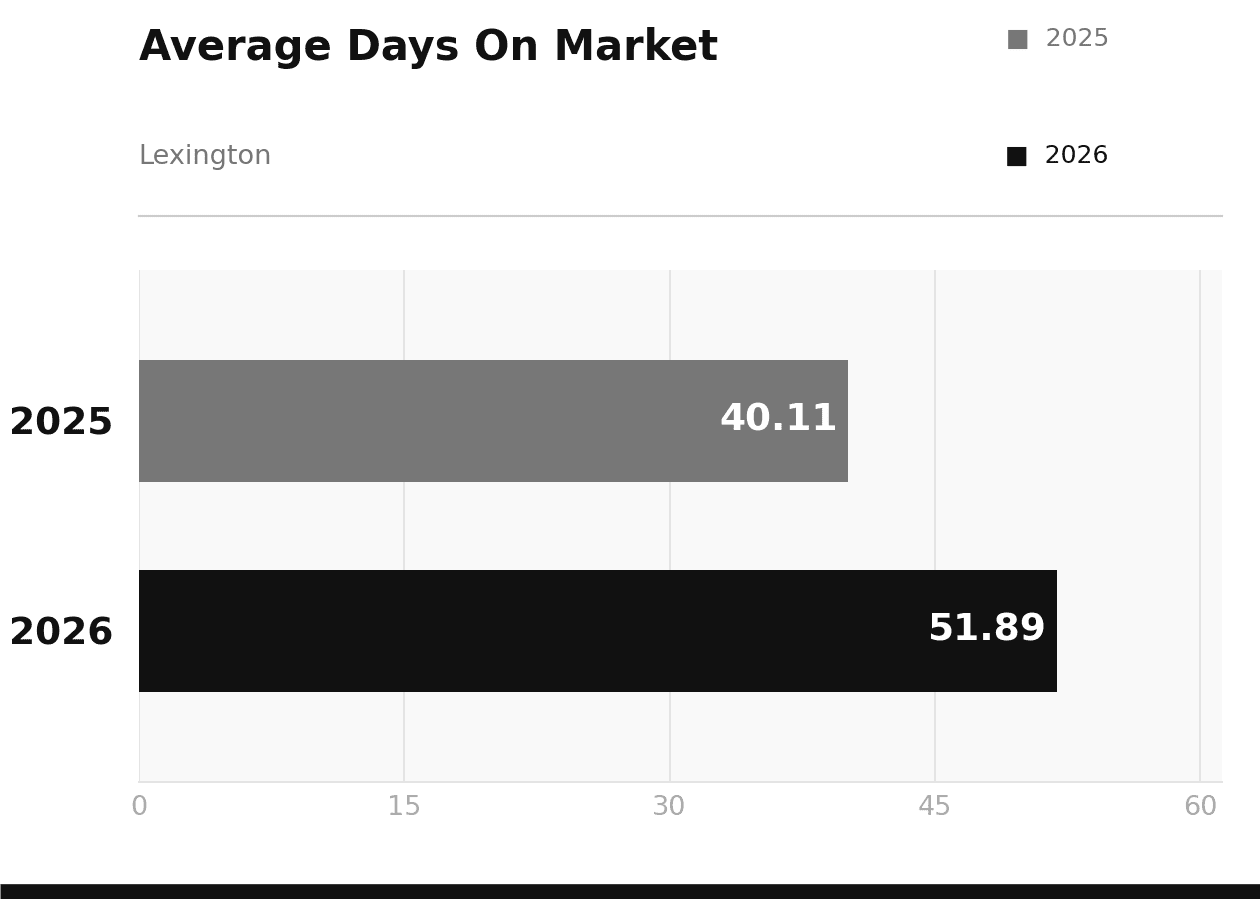
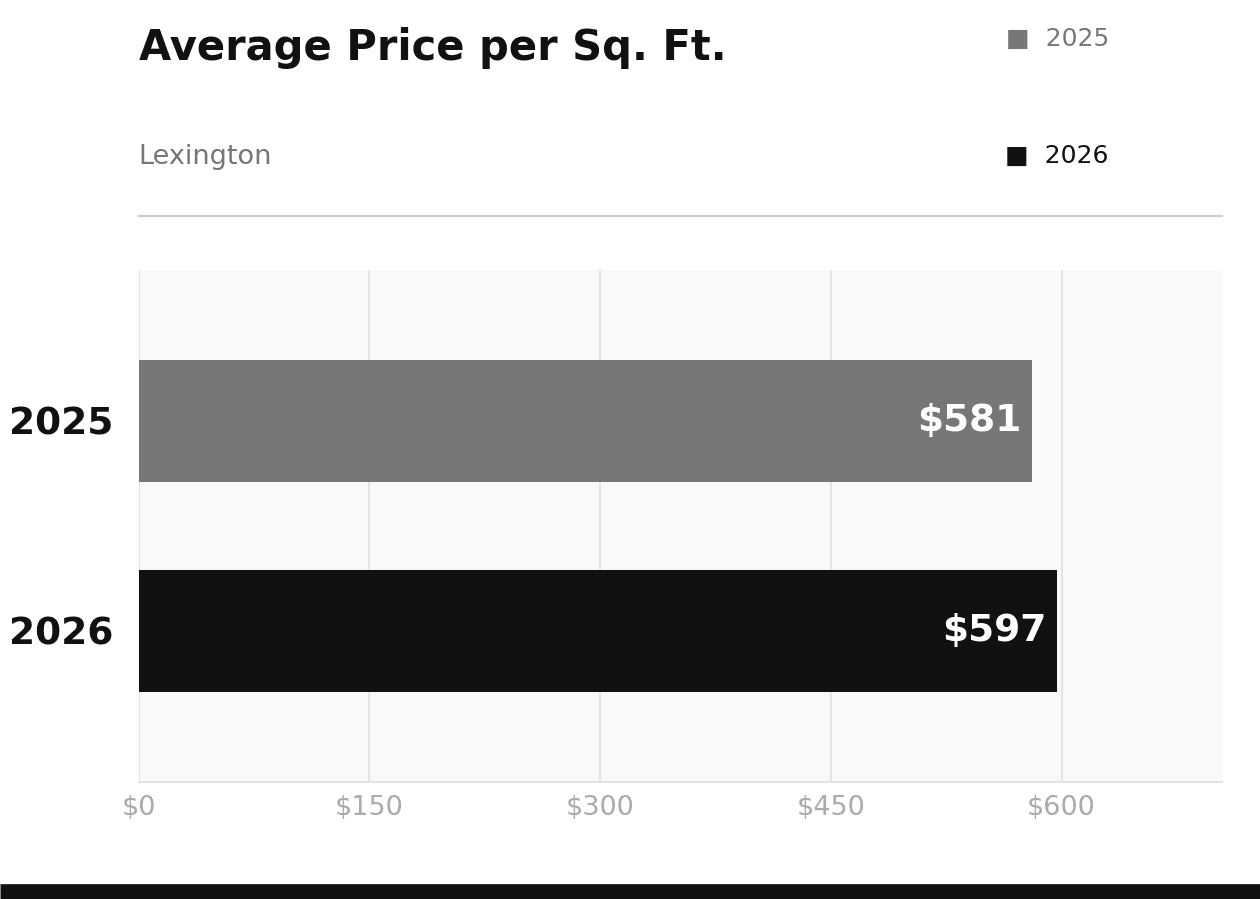
Lexington posted a rare result in May: exactly 62 homes closed in both May 2025 and May 2026. Volume came in at a perfect tie. Average sale price held nearly flat at $2,101,074 versus $2,132,393 a year ago, a difference of about 1.5%. Price per square foot ticked up from $581 to $597, a modest 2.7% improvement. The one number that shifted meaningfully was days on market, which rose from about 40 days in May 2025 to nearly 52 in 2026. Buyers are taking more time to evaluate before committing, even in a market they clearly want to be in.
For Lexington sellers, May 2026 is a straightforward data point: the market absorbed the same number of homes as last year at essentially the same prices. That is a stable market, not a declining one. Patience and correct pricing from the outset are what make the difference.
Arlington
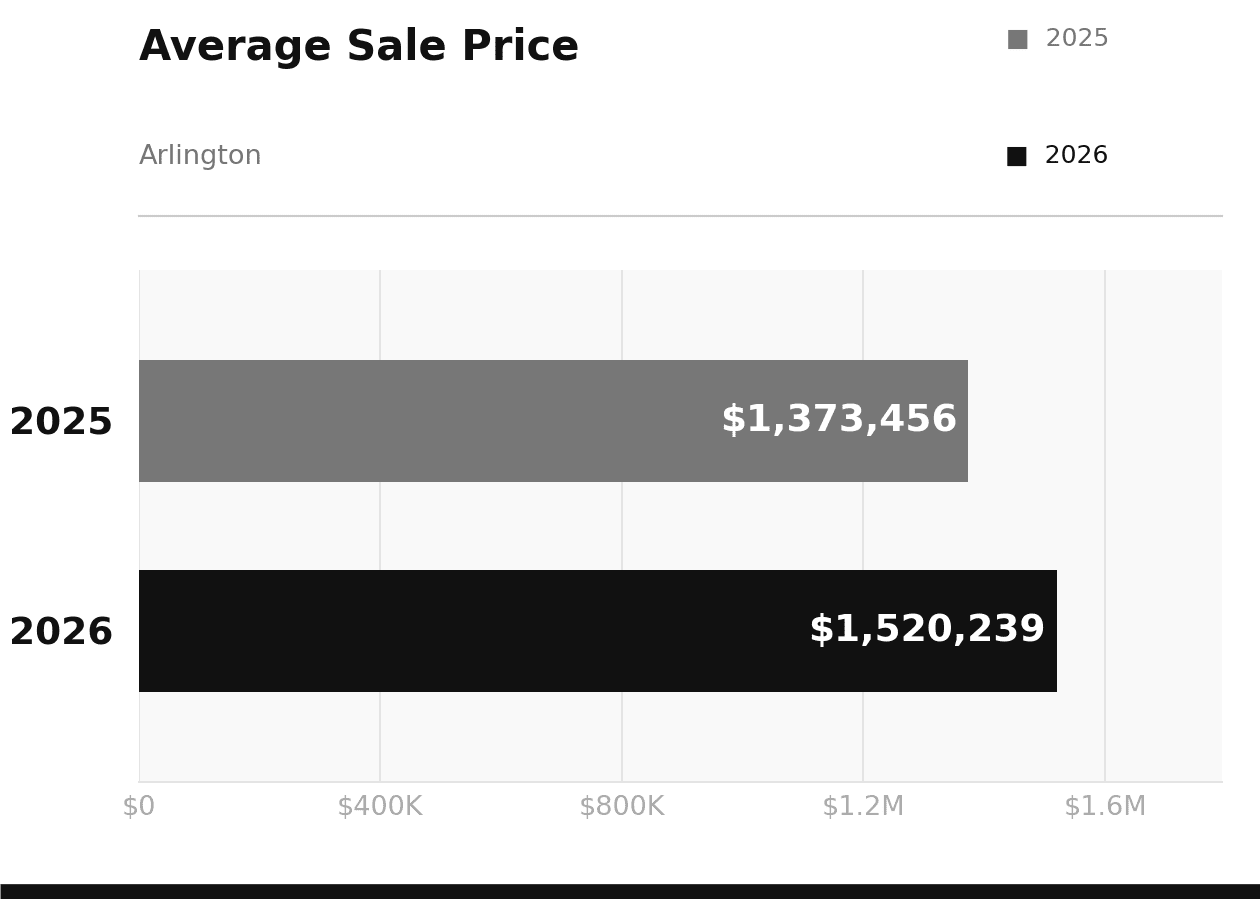
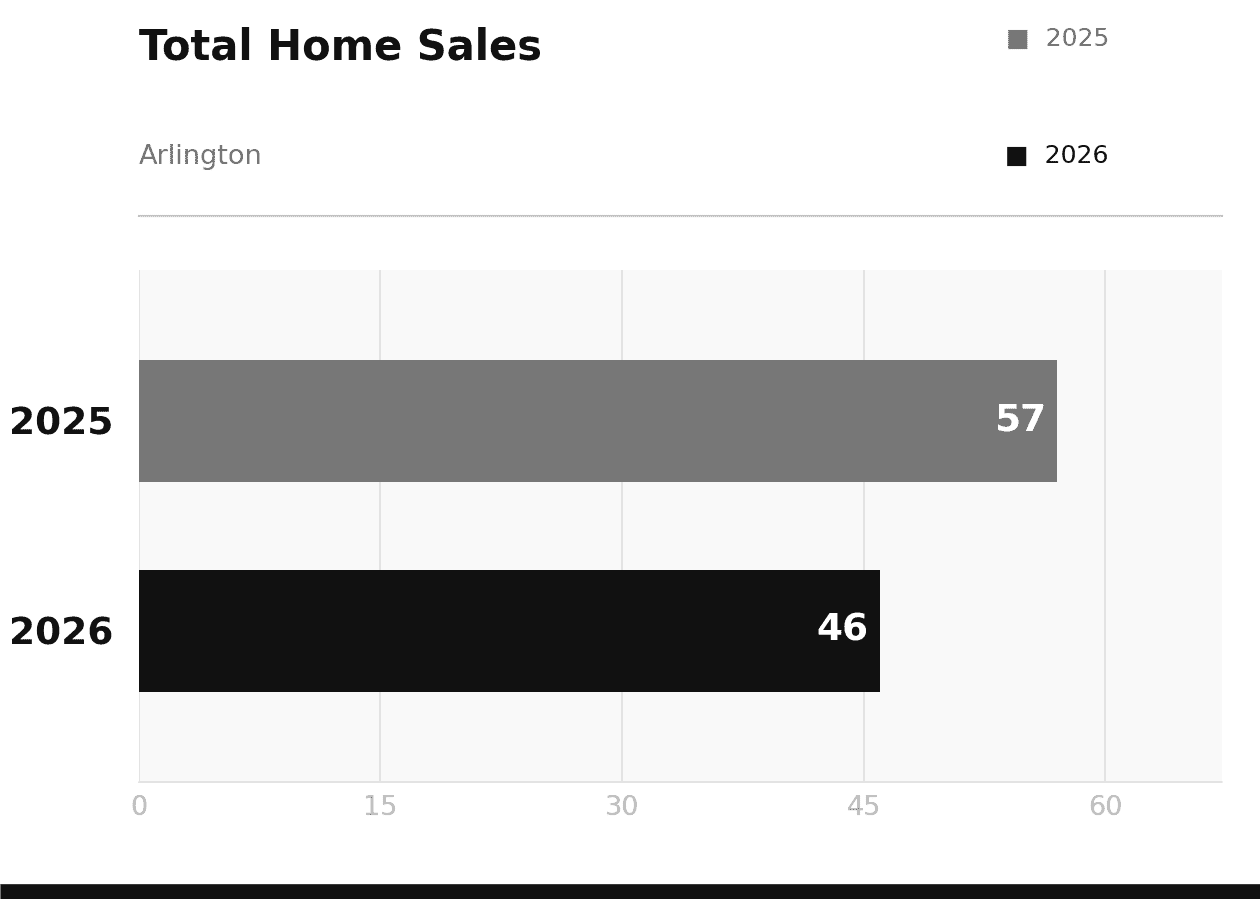
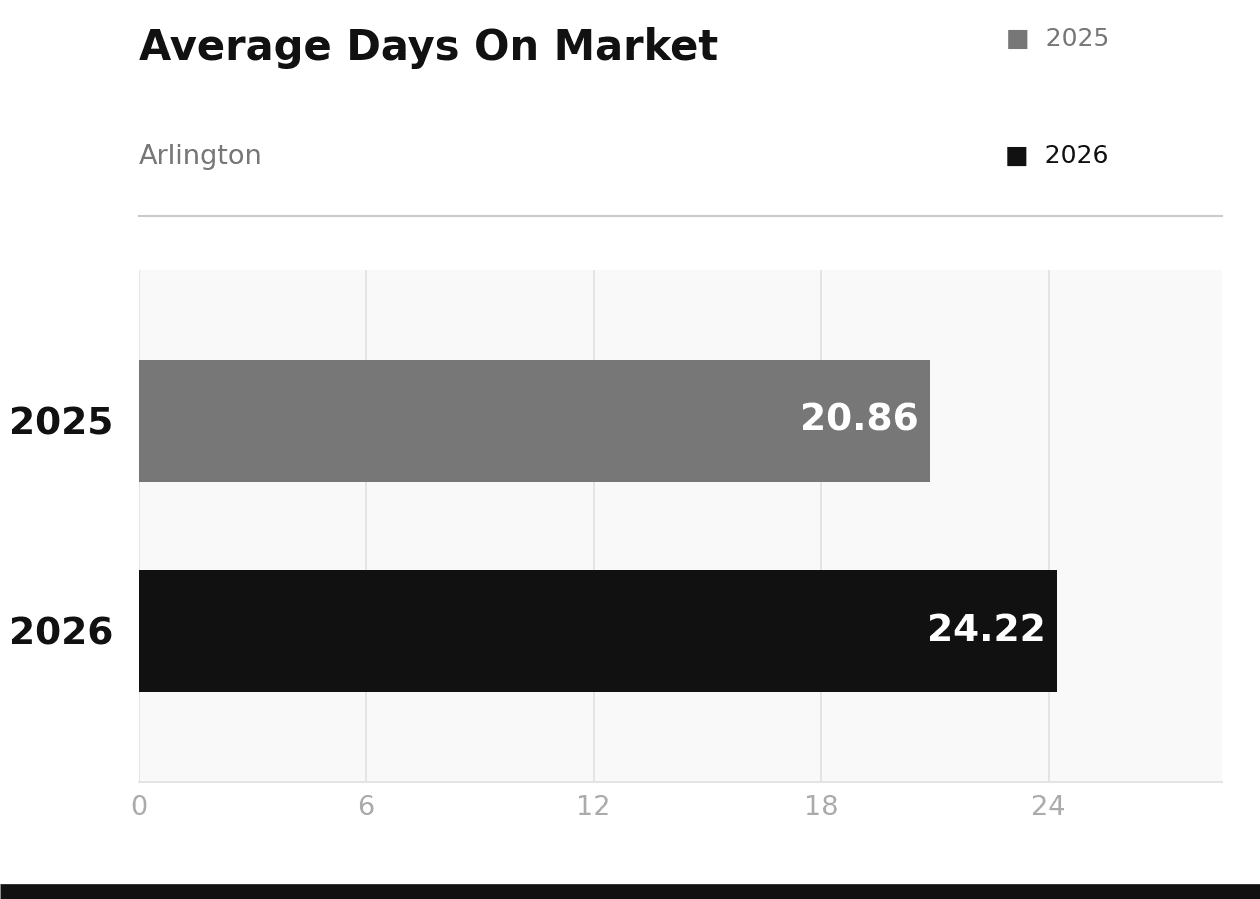
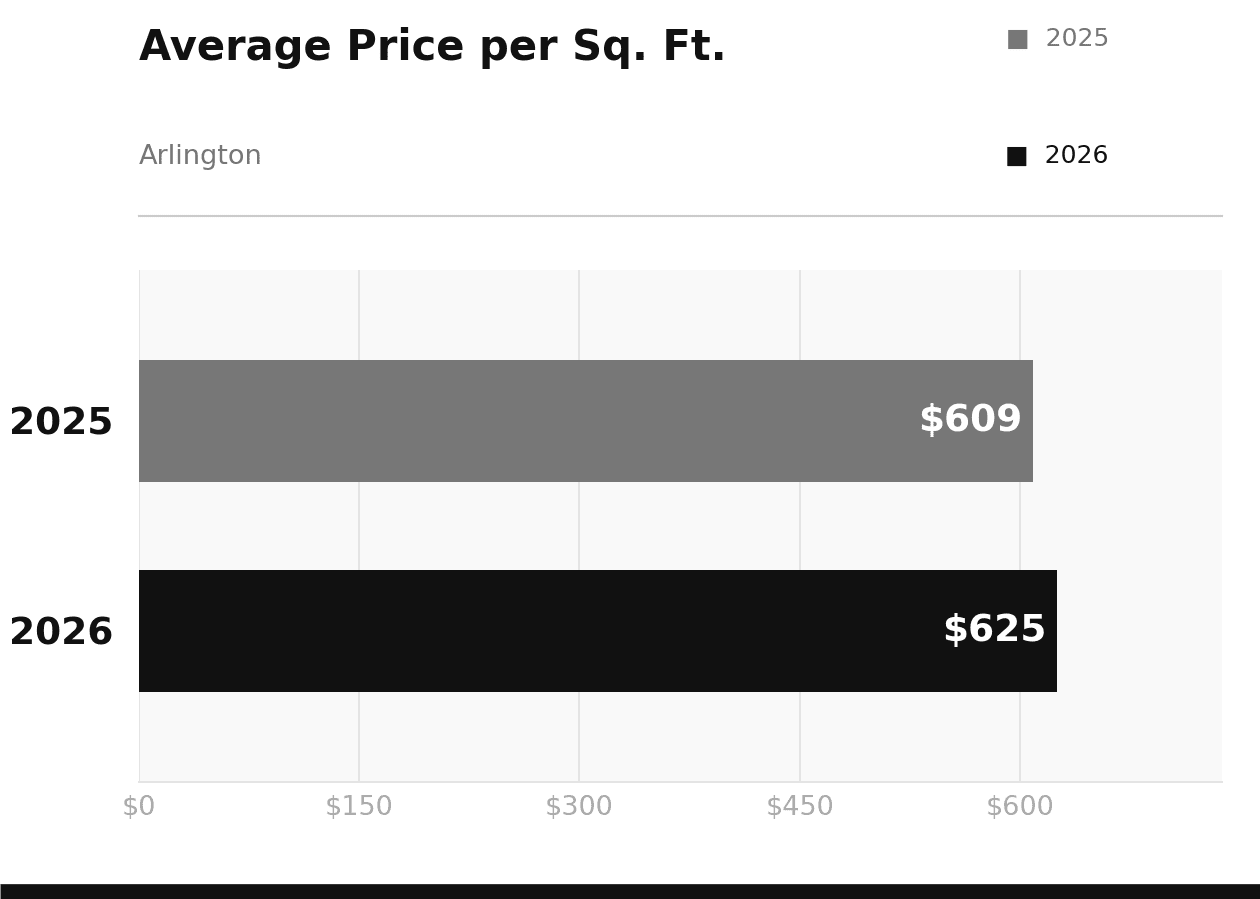
Arlington continued its strong 2026 run in May. Average sale prices came in at $1,520,239, up about 11% from $1,373,456 in May 2025. Price per square foot climbed from $609 to $625, a 2.6% gain that reflects real value movement rather than just a mix shift. Volume was lighter, with 46 closings versus 57 the prior year, and days on market edged up from about 21 days to just over 24. But those are both still strong numbers. Homes are moving in under 25 days on average, and sellers are getting more than they would have a year ago.
The combination of rising per-foot prices and fast days on market in a month with fewer overall transactions points to limited inventory keeping upward pressure on prices. If you are thinking about listing in Arlington, the supply-demand balance is currently in your favor.
What does this mean for your home?
Whether you are thinking about selling or simply keeping an eye on the market, Sven and the team are happy to walk you through what these numbers mean for your specific situation.