

July 20, 2026 | Market Reports
Real Estate Market Update | July 2026

The North of Boston real estate market continues to show mixed signals through July 2026, with each town telling its own story. Here is a closer look at how Winchester, Lexington, and Arlington are performing compared to the same period last year.
Arlington
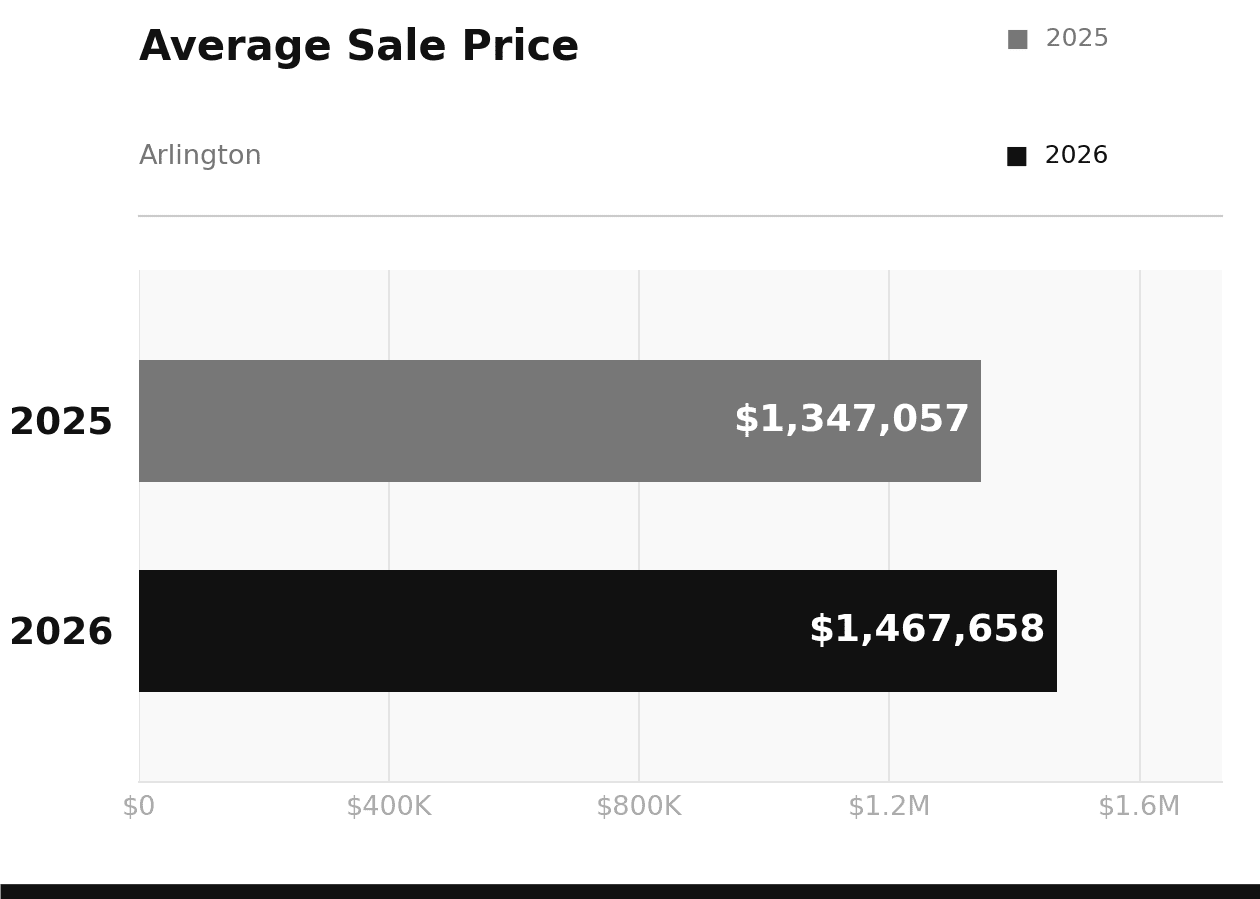
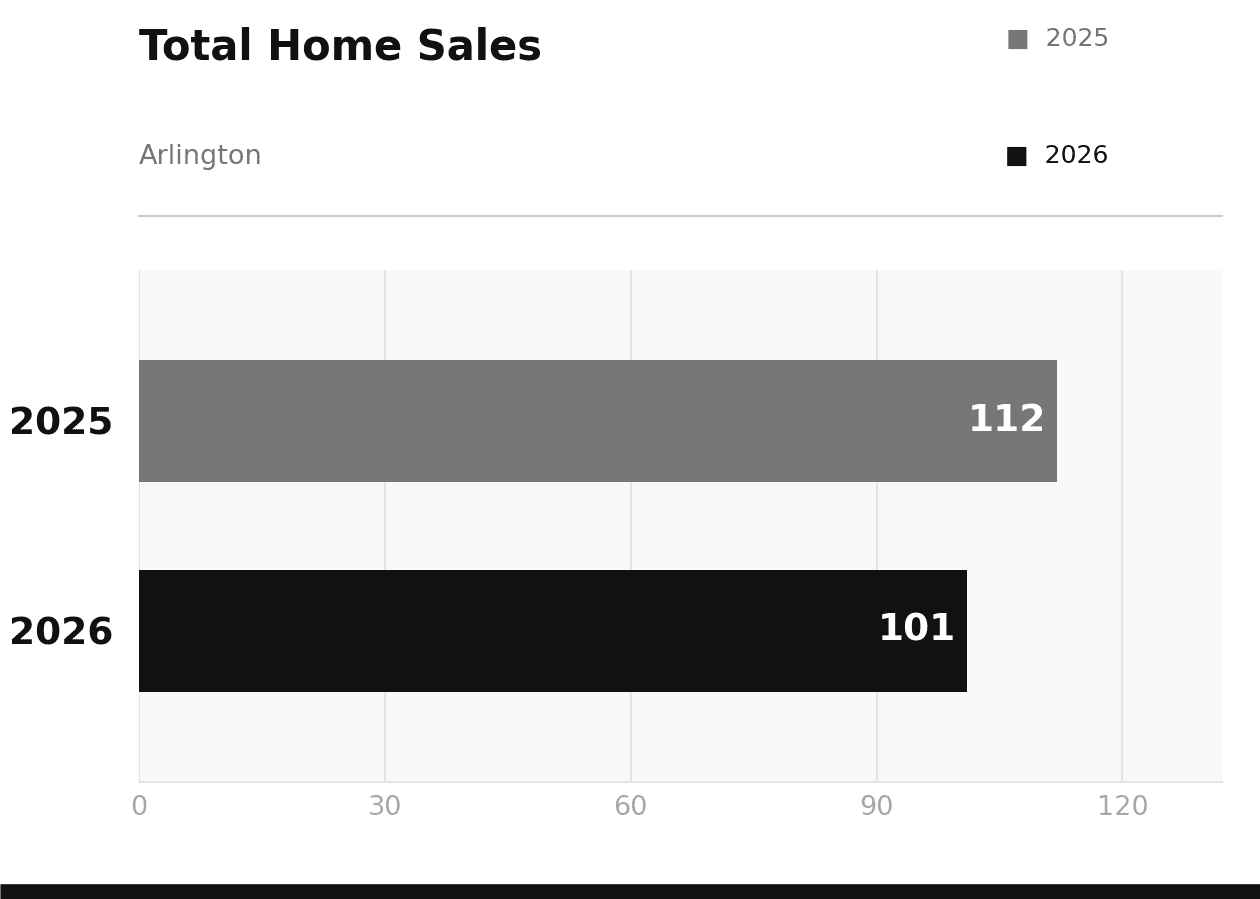
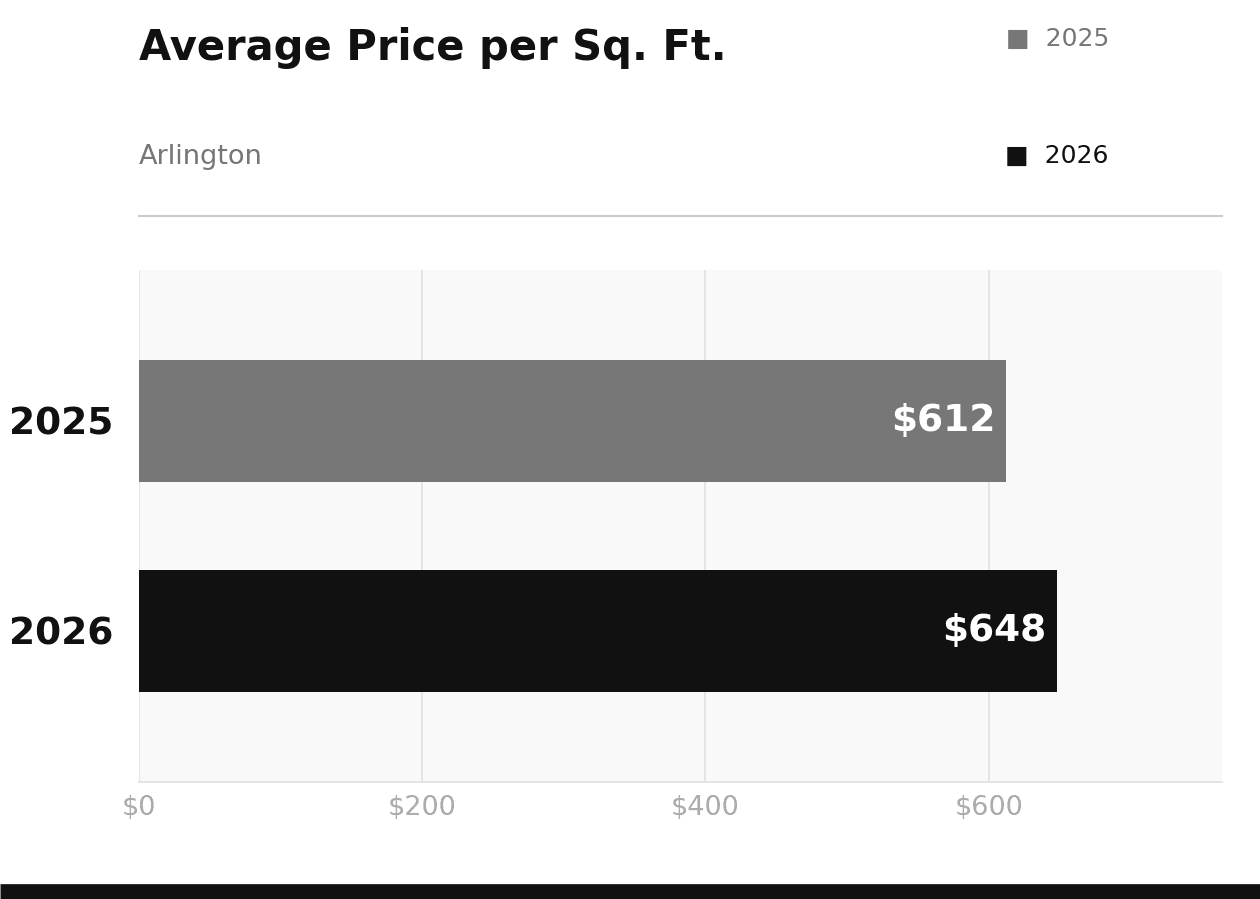
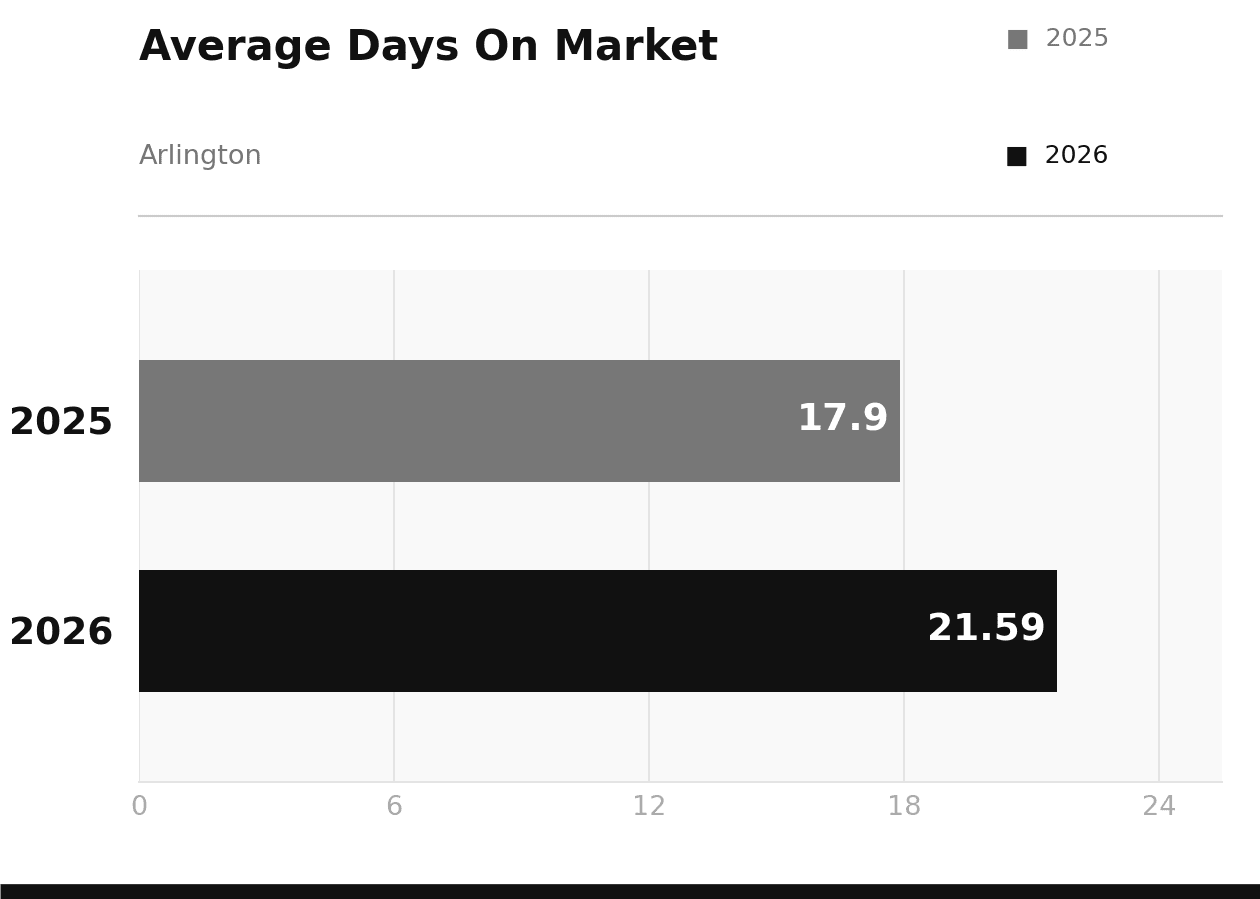
Arlington is moving in the right direction on price. With 101 sales so far this year compared to 112 through July 2025, inventory has tightened enough to push average sale prices up to $1,467,658 from $1,347,057 a year ago. Price per square foot climbed from $612 to $648. Homes are selling in about 22 days on average, a modest increase from 18 days last year, but still a fast-moving market overall.
Lexington
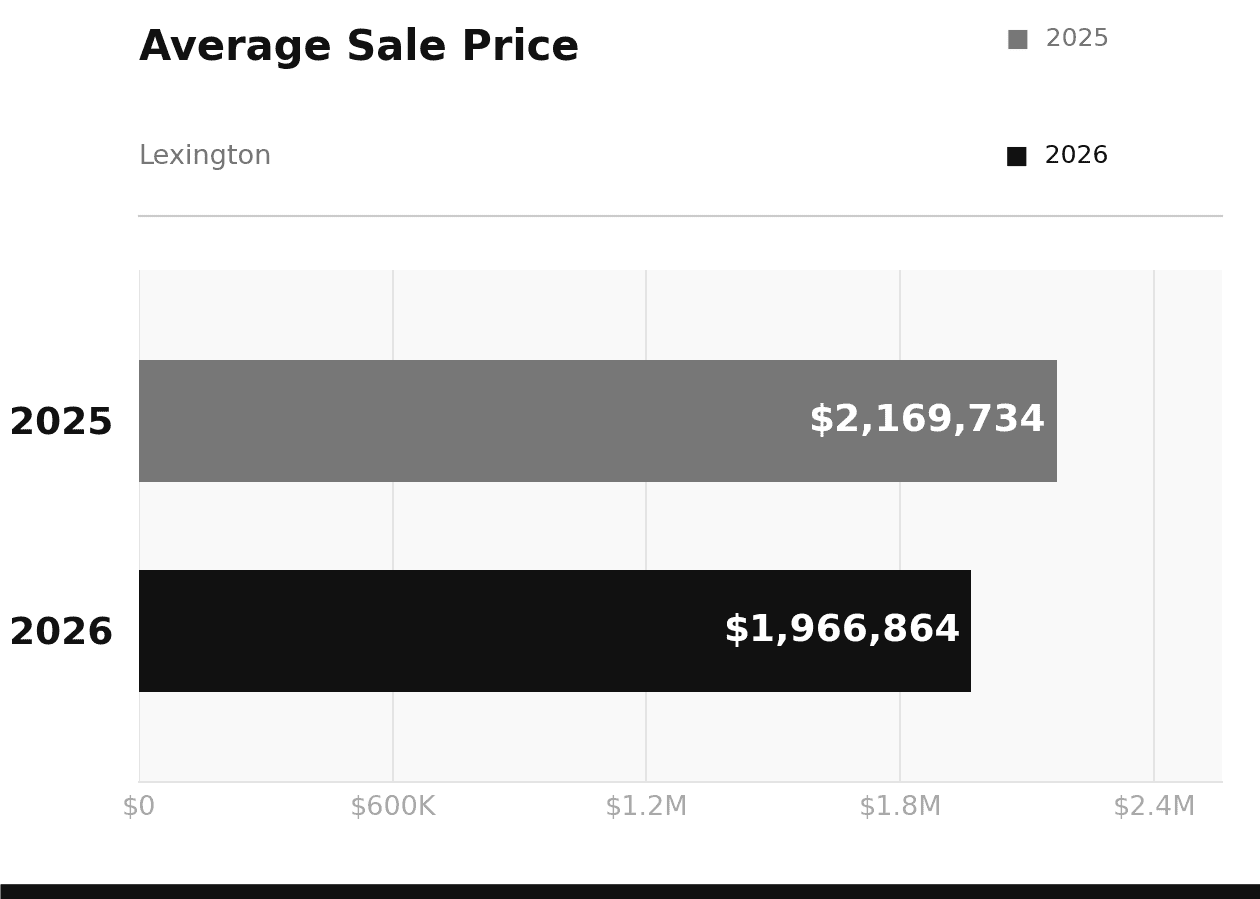
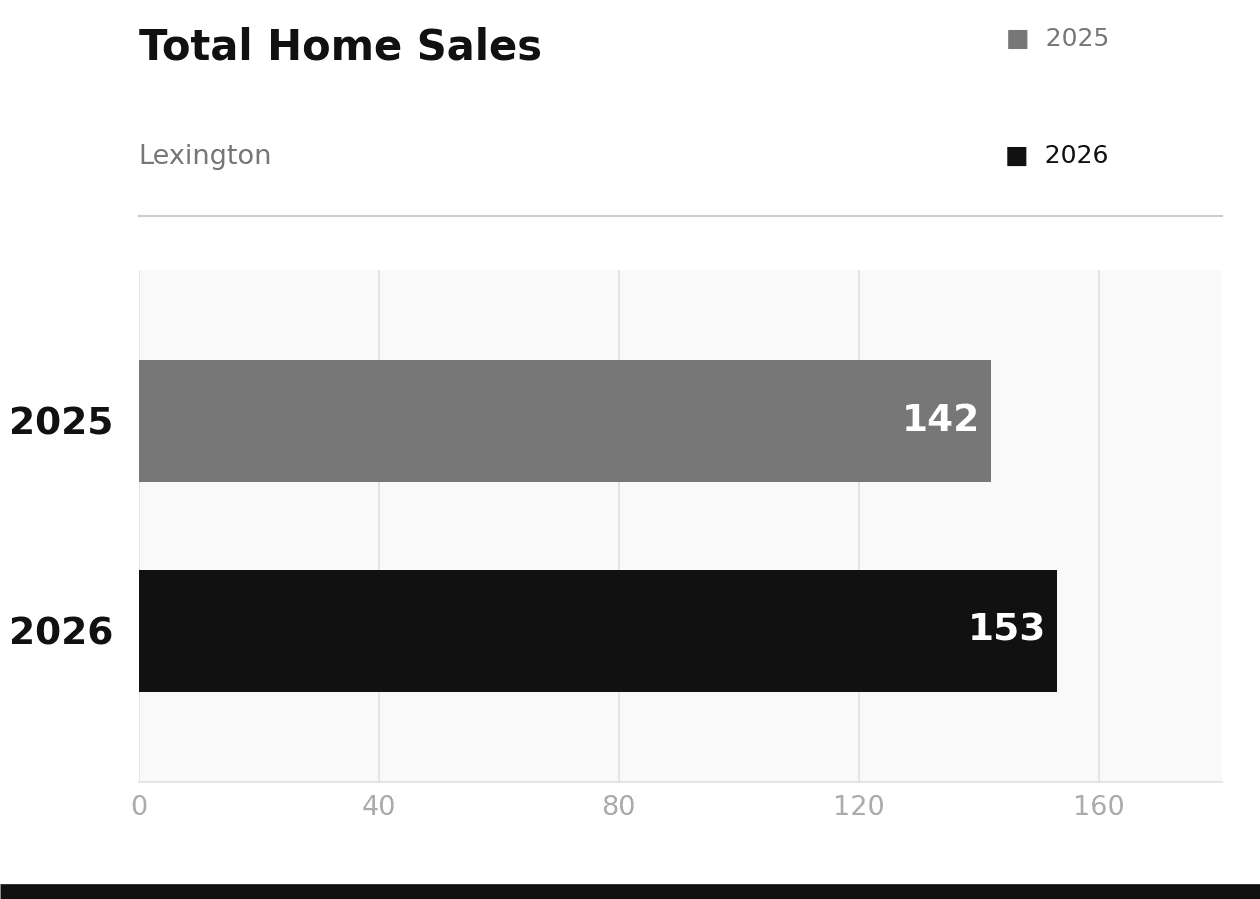
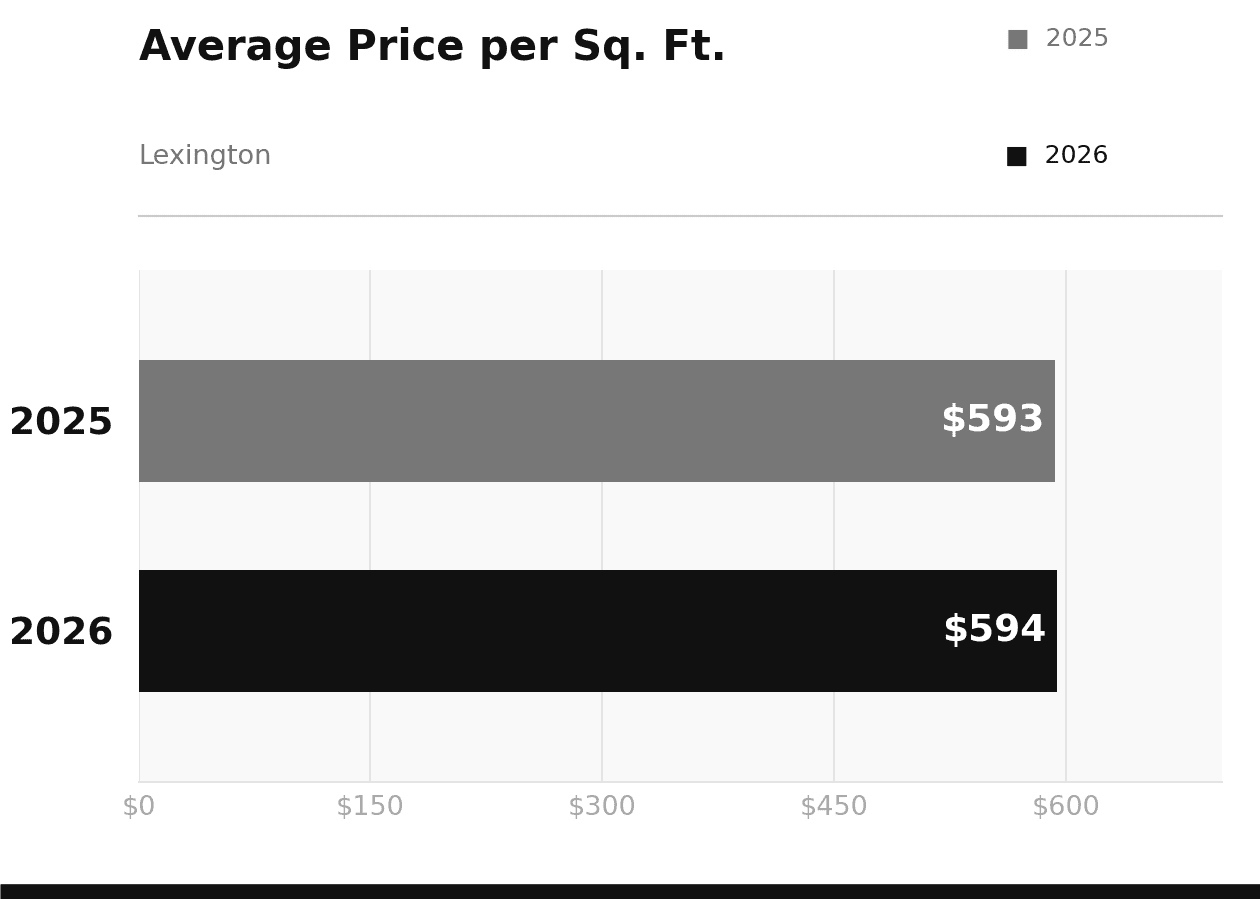
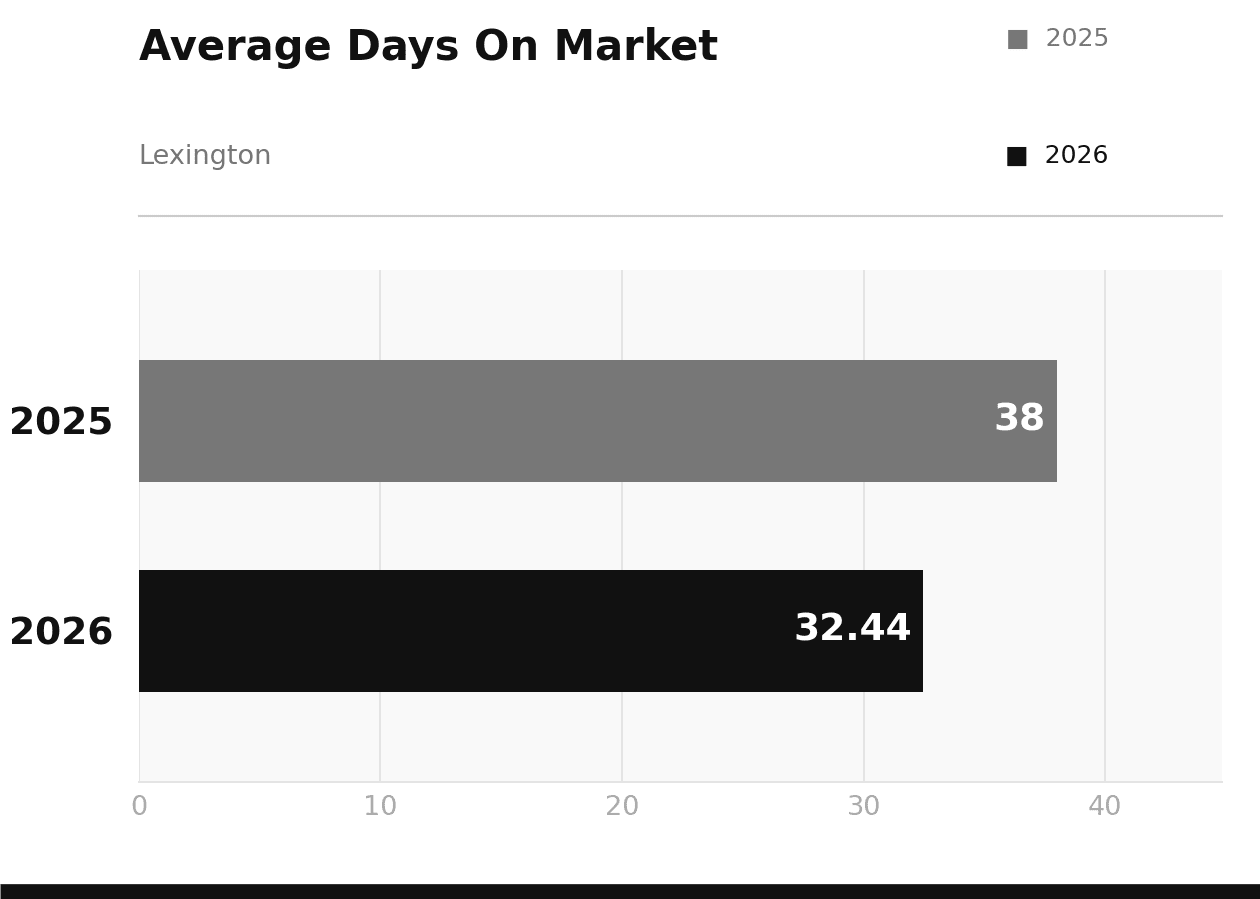
Lexington stands out with the strongest sales volume growth, with 153 homes sold versus 142 through July 2025. Average sale prices dipped to $1,966,864 from $2,169,734 a year ago, likely reflecting a broader mix of homes coming to market rather than a drop in demand. Price per square foot held essentially flat at $594 versus $593. Homes are also selling faster, averaging 32 days on market compared to 38 last year, which points to continued buyer interest at every price point.
Winchester
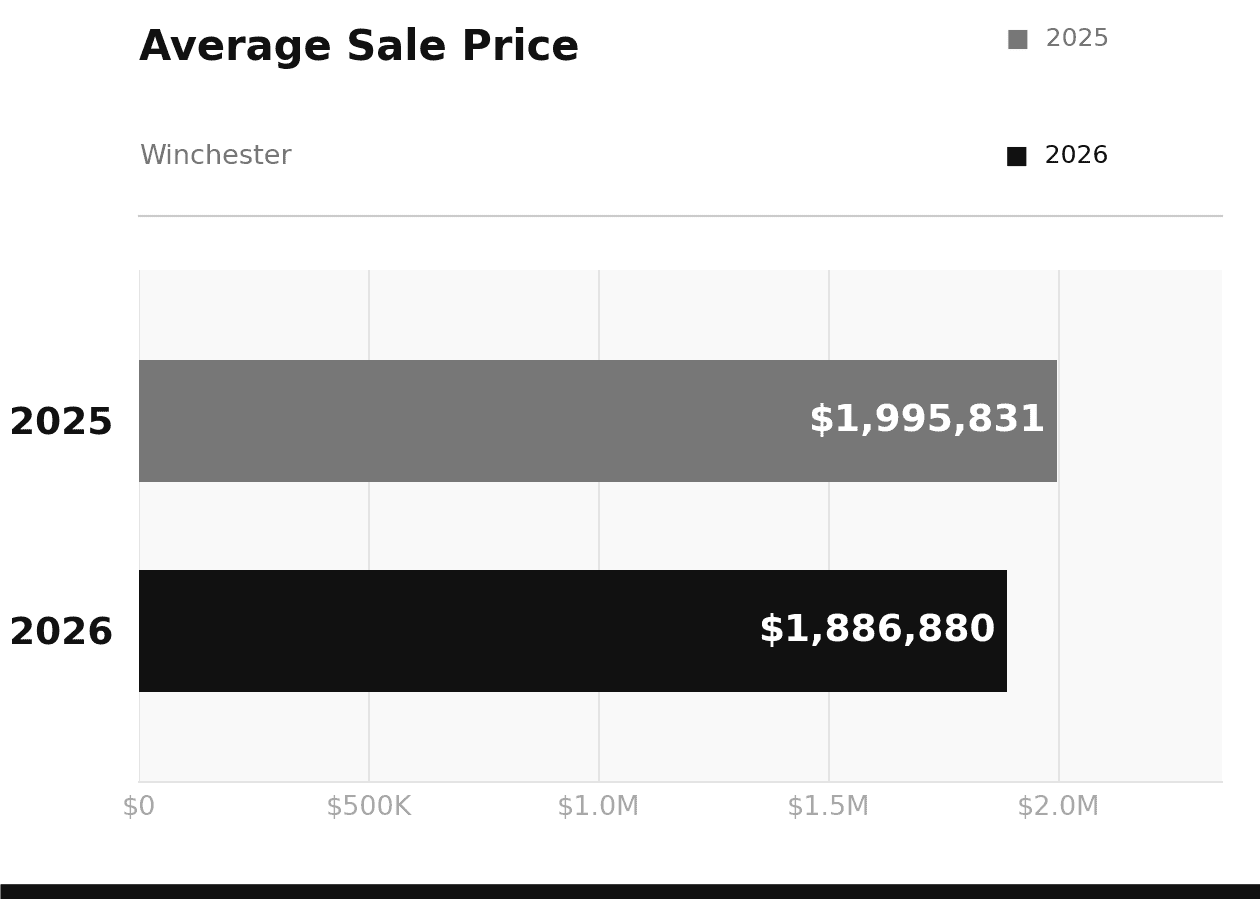
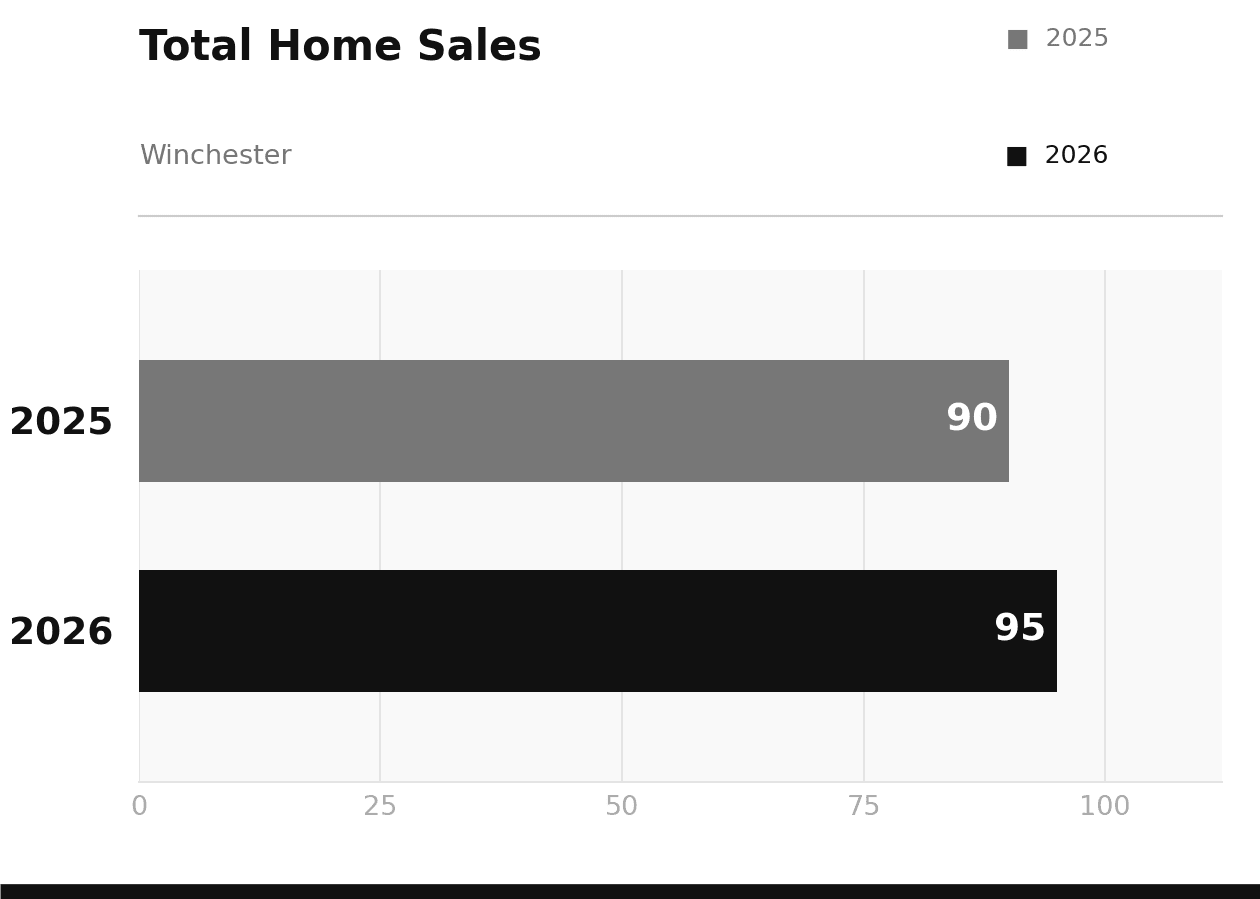
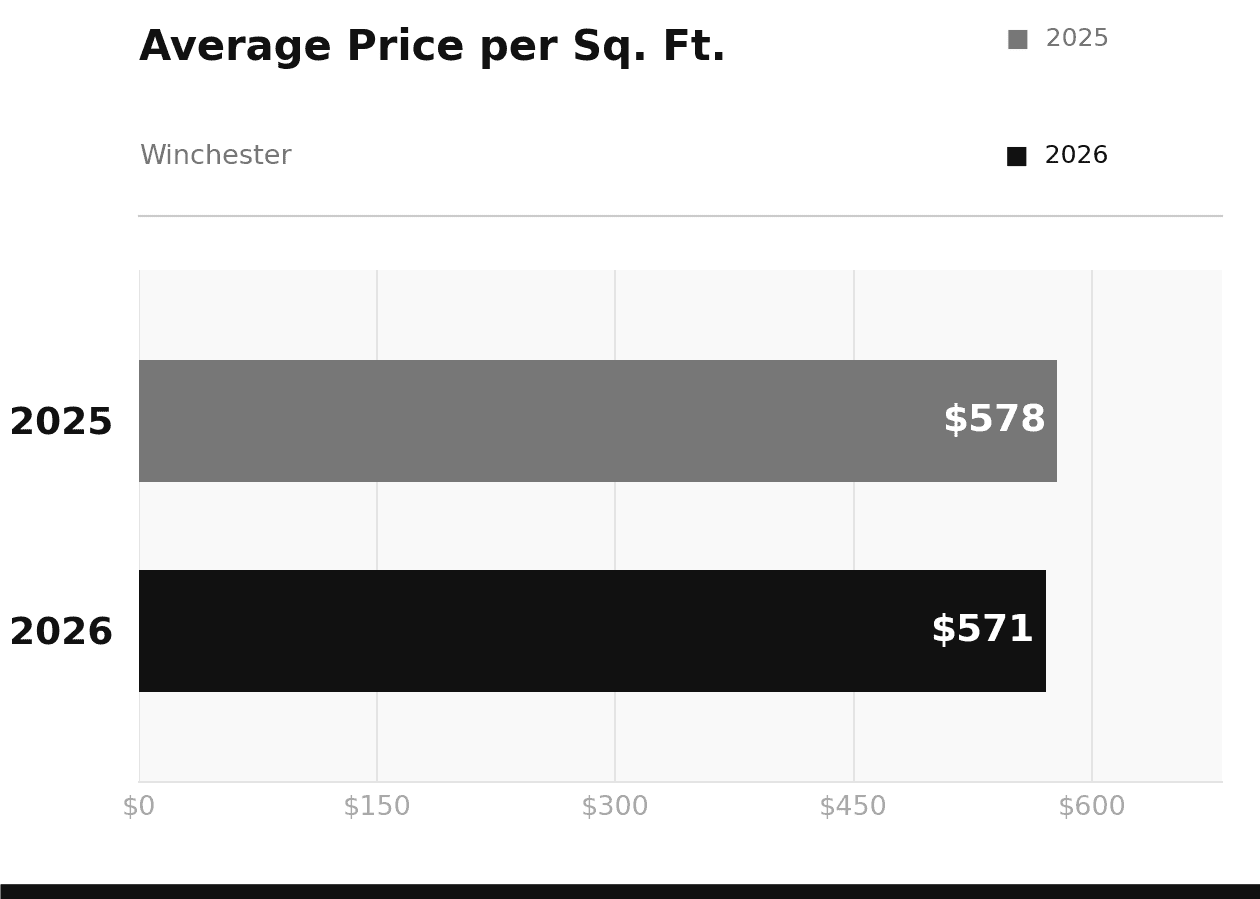
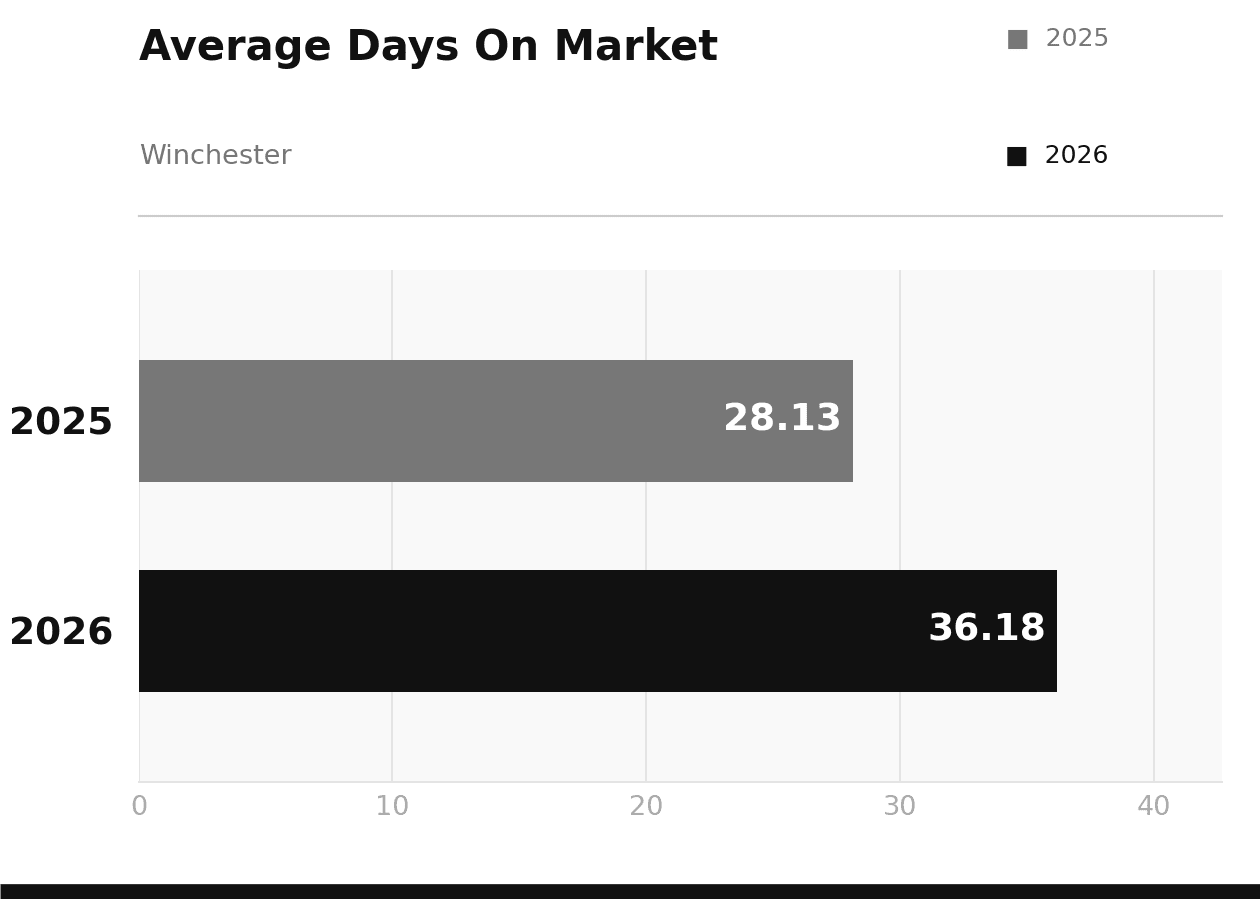
In Winchester, sales volume is up slightly year over year, with 95 homes sold compared to 90 through July 2025. Average sale prices have softened to $1,886,880 from $1,995,831, and homes are taking a bit longer to sell, averaging 36 days on market versus 28 last year. Price per square foot dipped slightly from $578 to $571. The data suggests buyers have a little more breathing room than they did in 2025, though Winchester remains one of the most sought-after markets north of Boston.
What does this mean for your home?
Whether you are thinking about selling this fall or keeping an eye on the market, Sven and the team are happy to walk you through what these numbers mean for your specific situation.