

February 28, 2026 | Market Reports
Real Estate Market Update | February 2026

February is typically the quietest month of the real estate year across the North of Boston market, and 2026 was no exception. Low inventory and winter timing kept transaction counts modest in all three towns. That said, there were some meaningful signals in the data worth paying attention to. Here is how Winchester, Lexington, and Arlington performed compared to February 2025.
Winchester
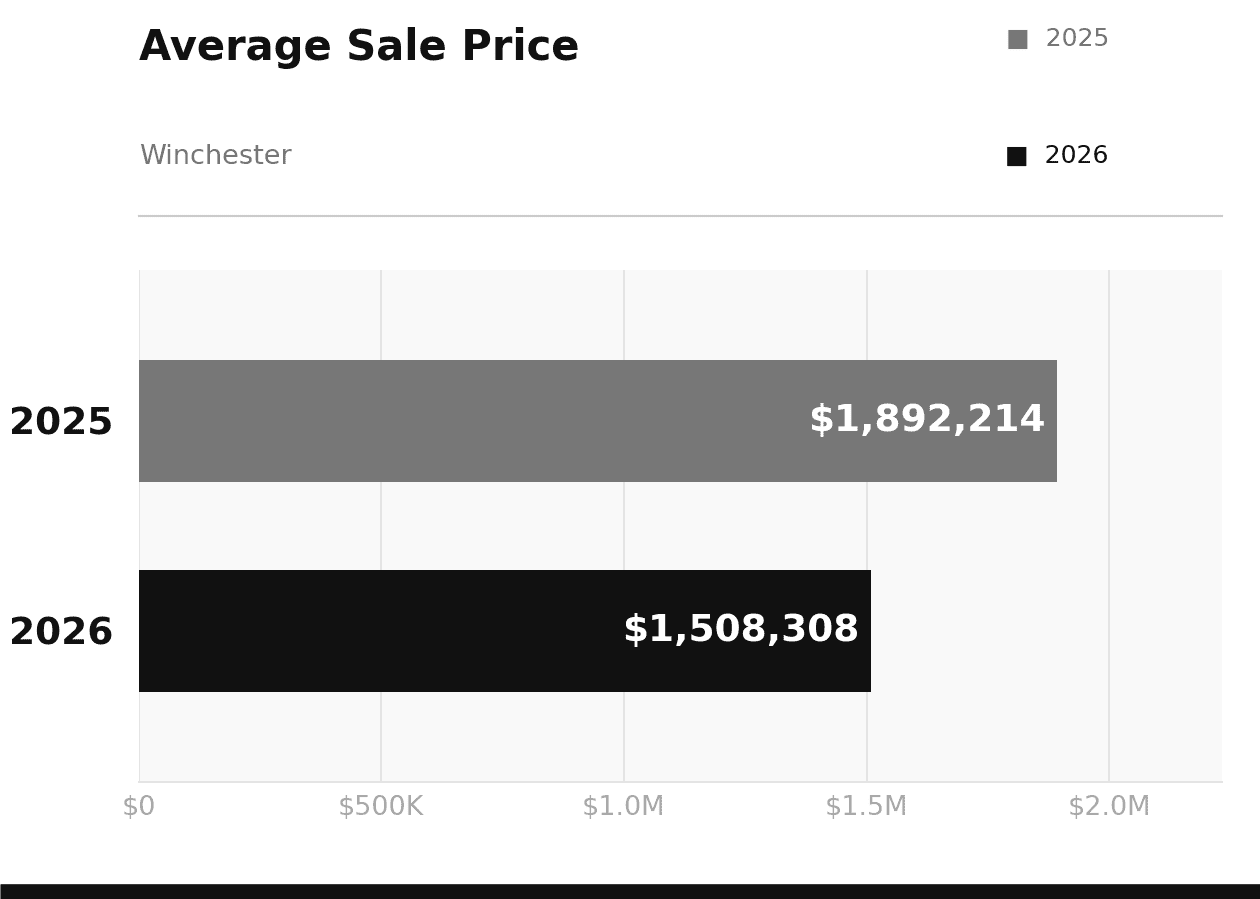
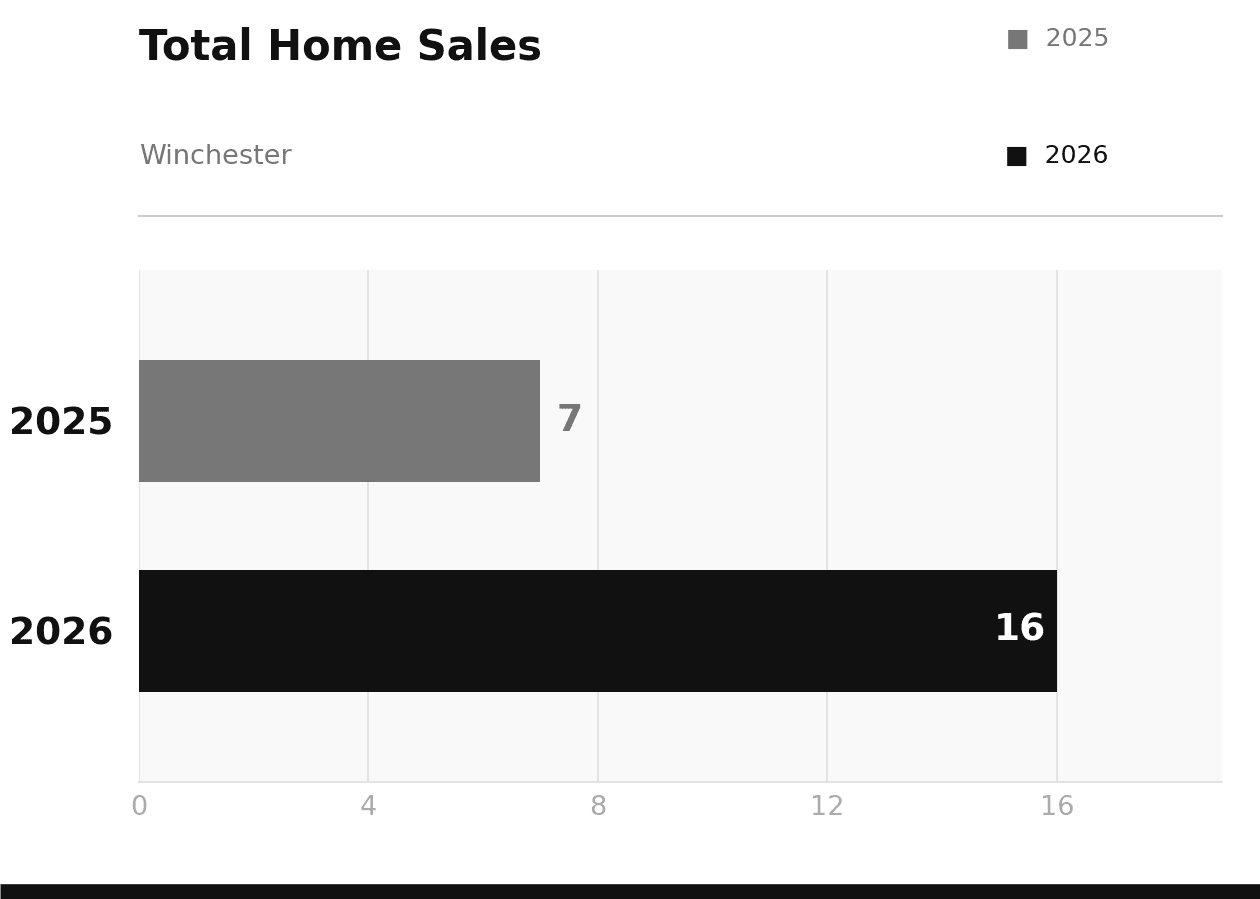
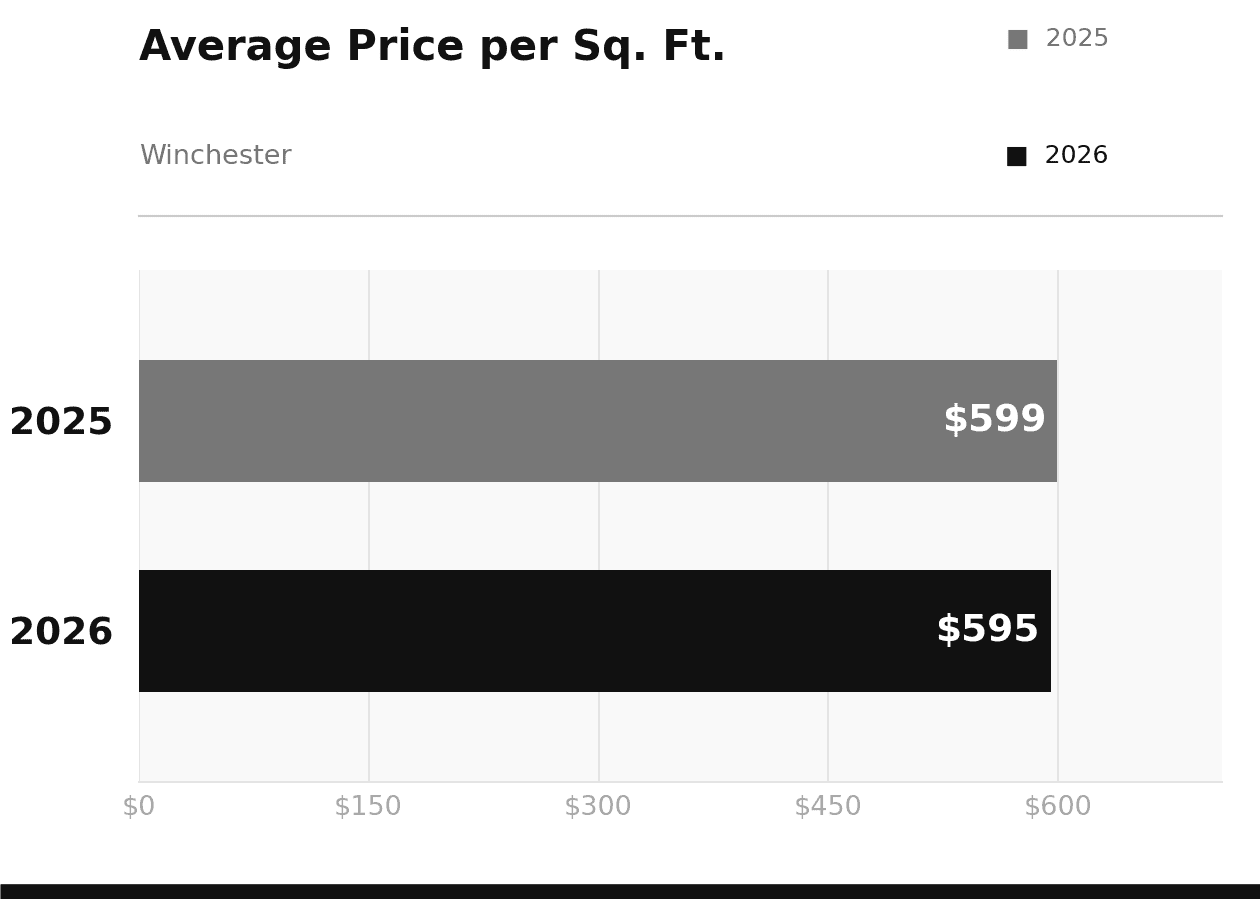
Winchester stood out in February with sales volume more than doubling year-over-year. Sixteen homes closed compared to just 7 in February 2025, a notable jump for a winter month. Average sale price came in at $1,508,308 versus $1,892,214 a year ago, but with only 7 transactions in 2025 as the comparison point, the average figure swings significantly based on which properties happened to close. Price per square foot dropped by only $4, from $599 to $595, which tells a much more stable story about underlying values.
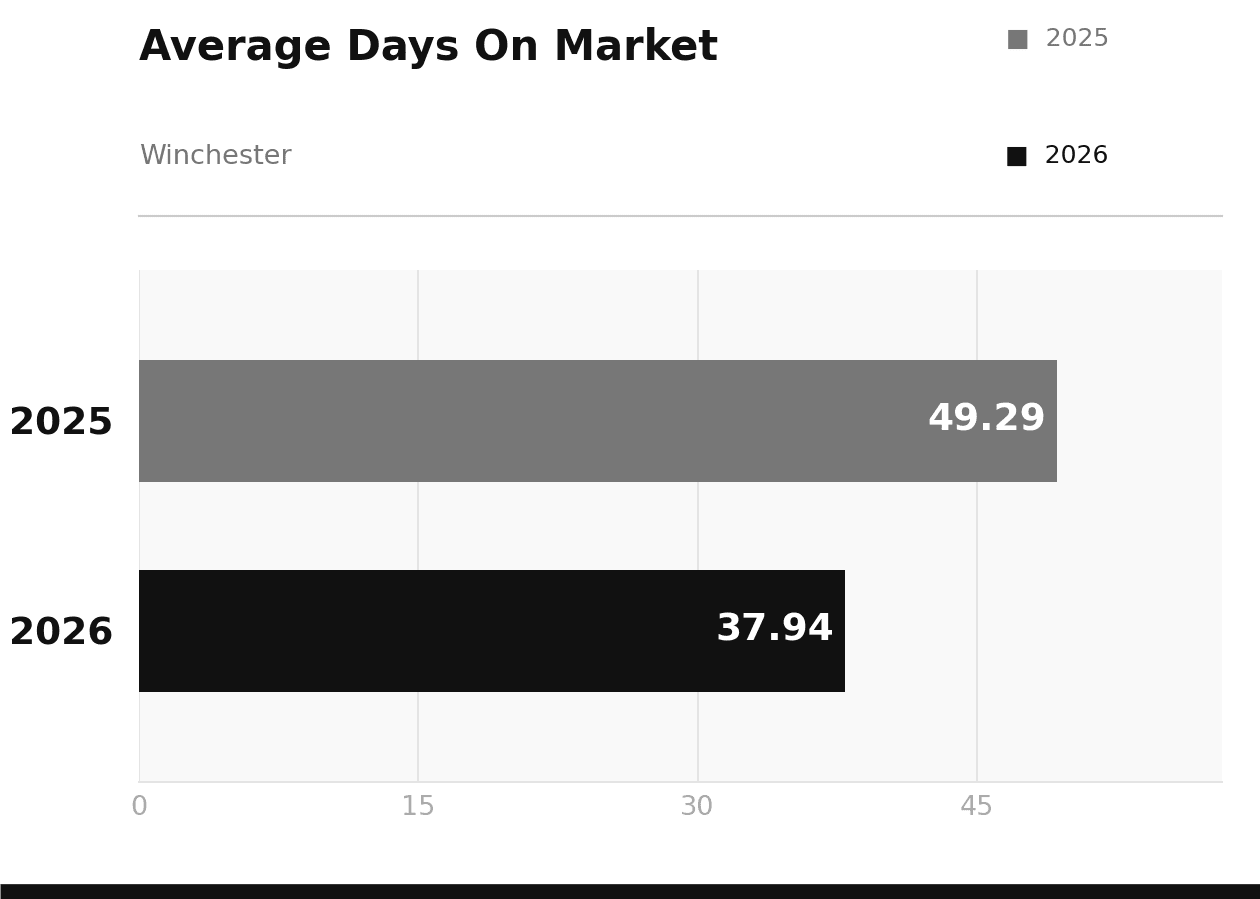
Days on market actually improved year-over-year, falling from about 49 days in February 2025 to just under 38 in 2026. Homes that entered the market priced correctly found buyers with less waiting than the prior winter. That is a good sign heading into spring.
Lexington
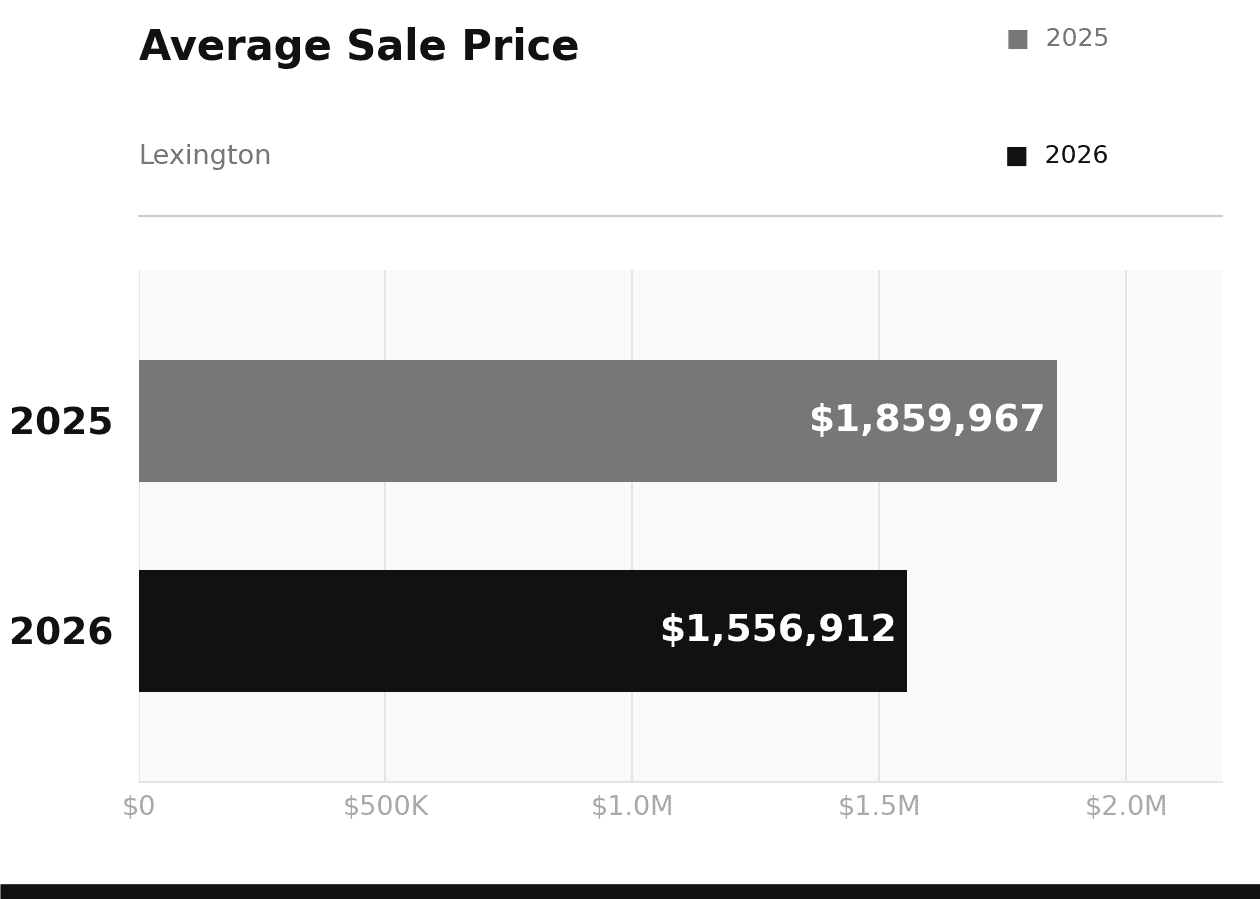
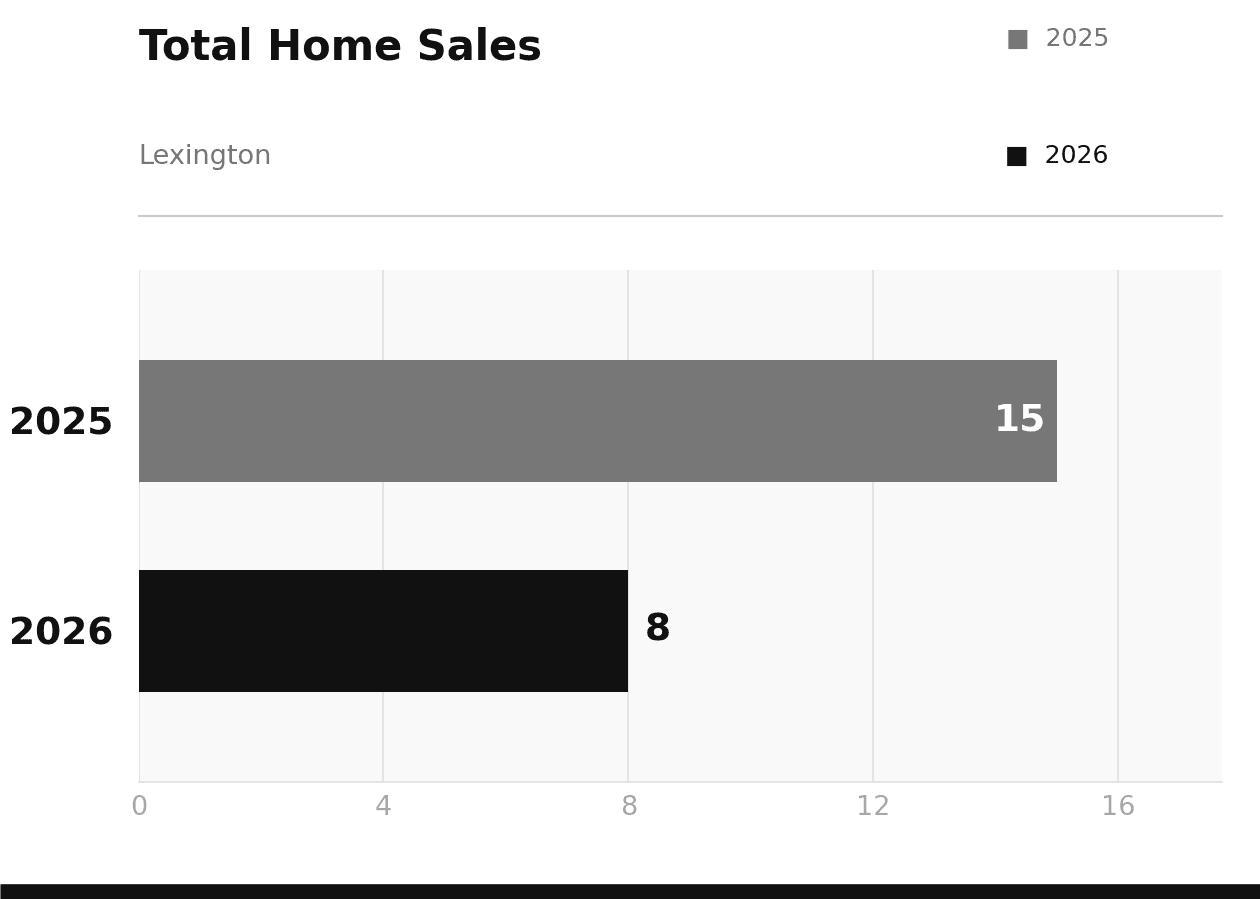
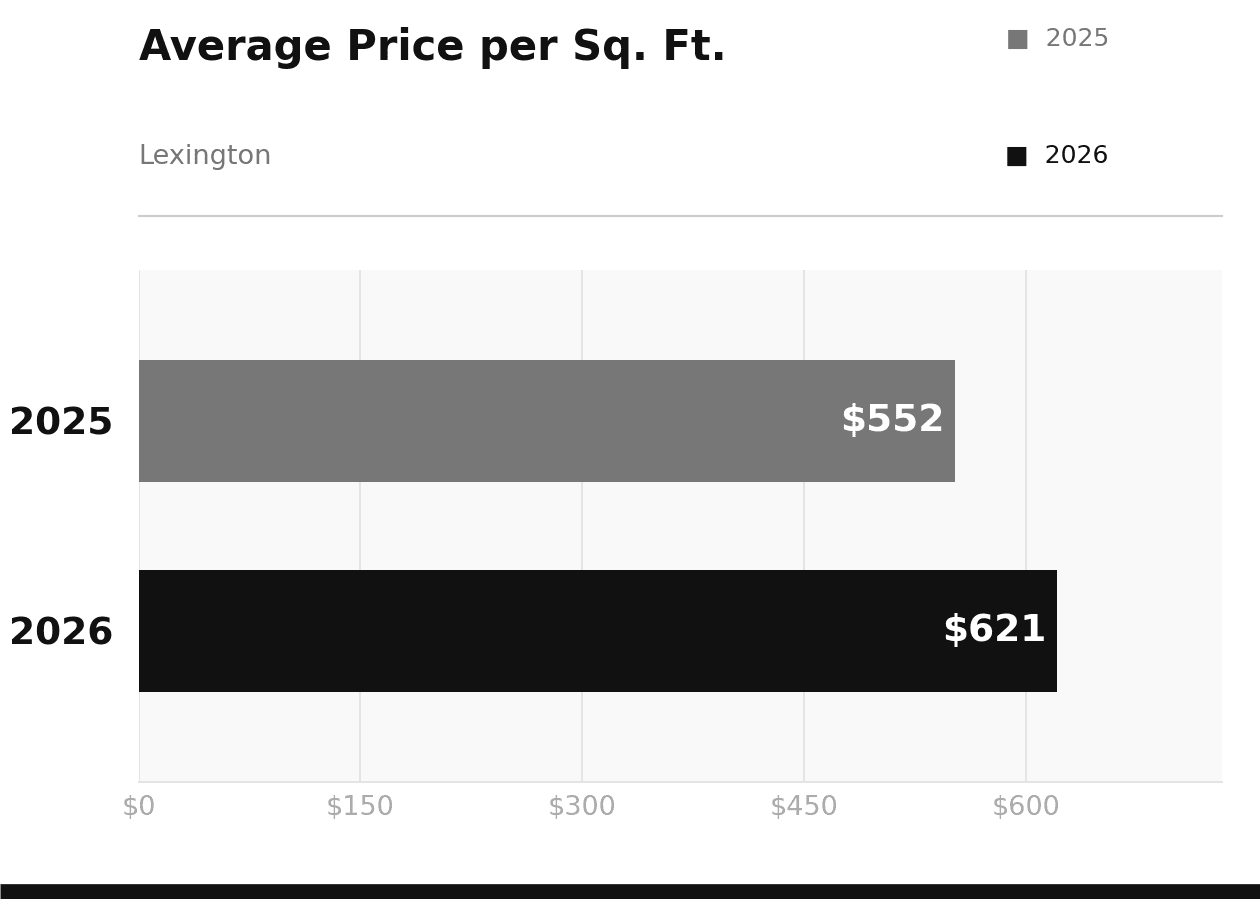
Lexington saw a quieter February with only 8 homes closing versus 15 in February 2025. Average sale price fell from $1,859,967 to $1,556,912, which again reflects the mix of homes that happened to close in a thin winter market more than any meaningful shift in Lexington’s underlying value. The standout number here is price per square foot, which climbed 12.5% from $552 to $621. Even in a slow month, the homes that sold in Lexington commanded strong per-foot prices.
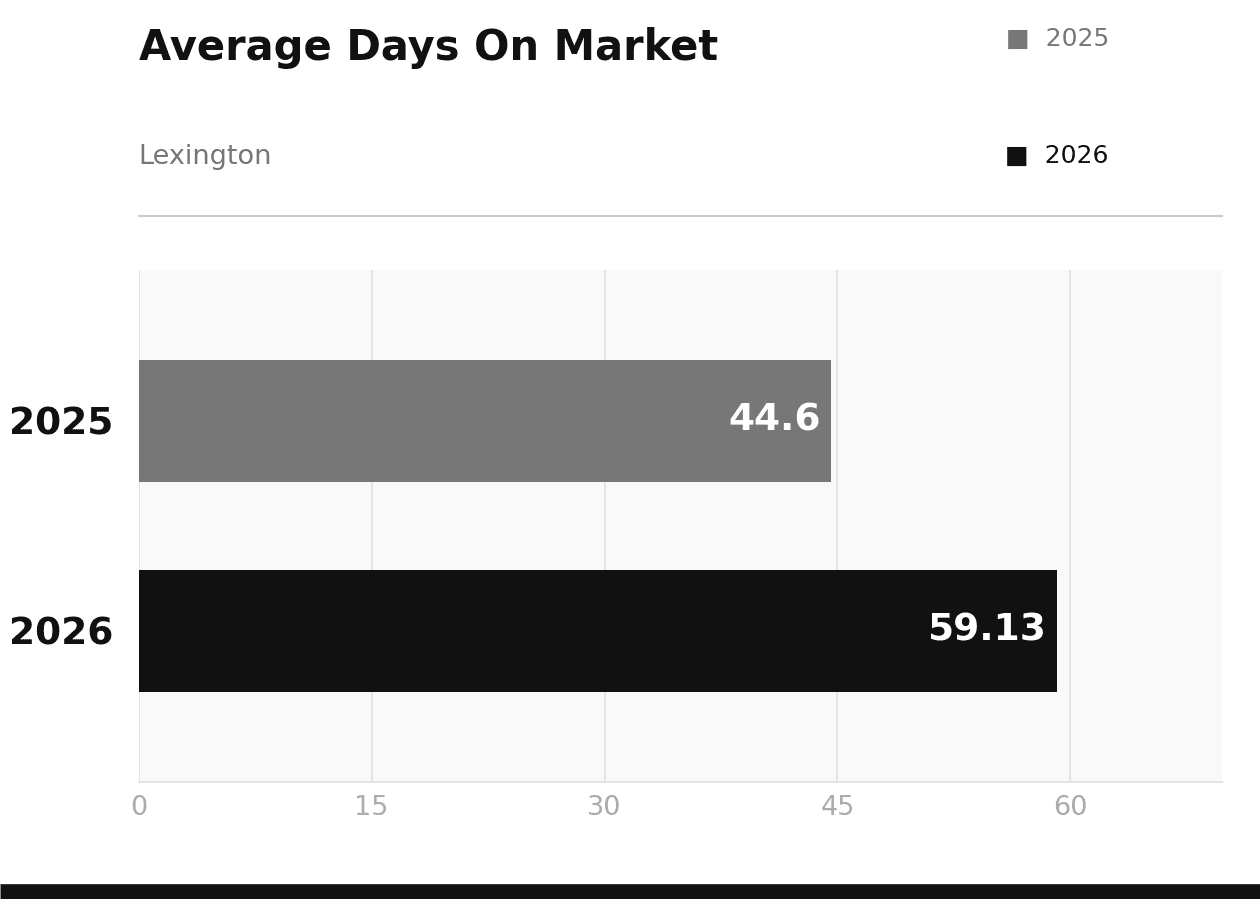
Days on market stretched to 59 days this February compared to about 45 the prior year. A slower pace is expected in winter, and with fewer homes transacting, individual sales can move that figure around considerably. Lexington’s demand base remains intact for well-priced homes in good condition.
Arlington
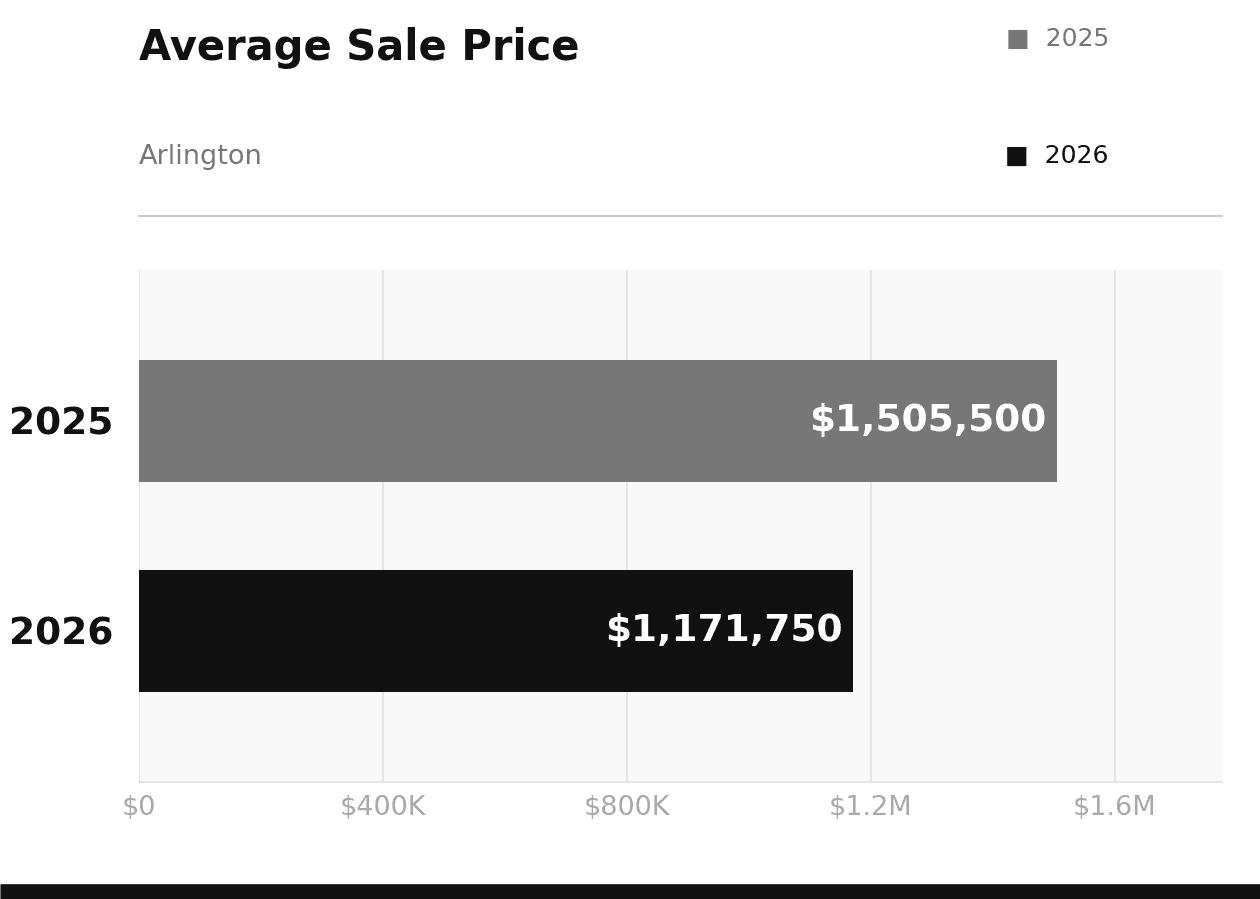
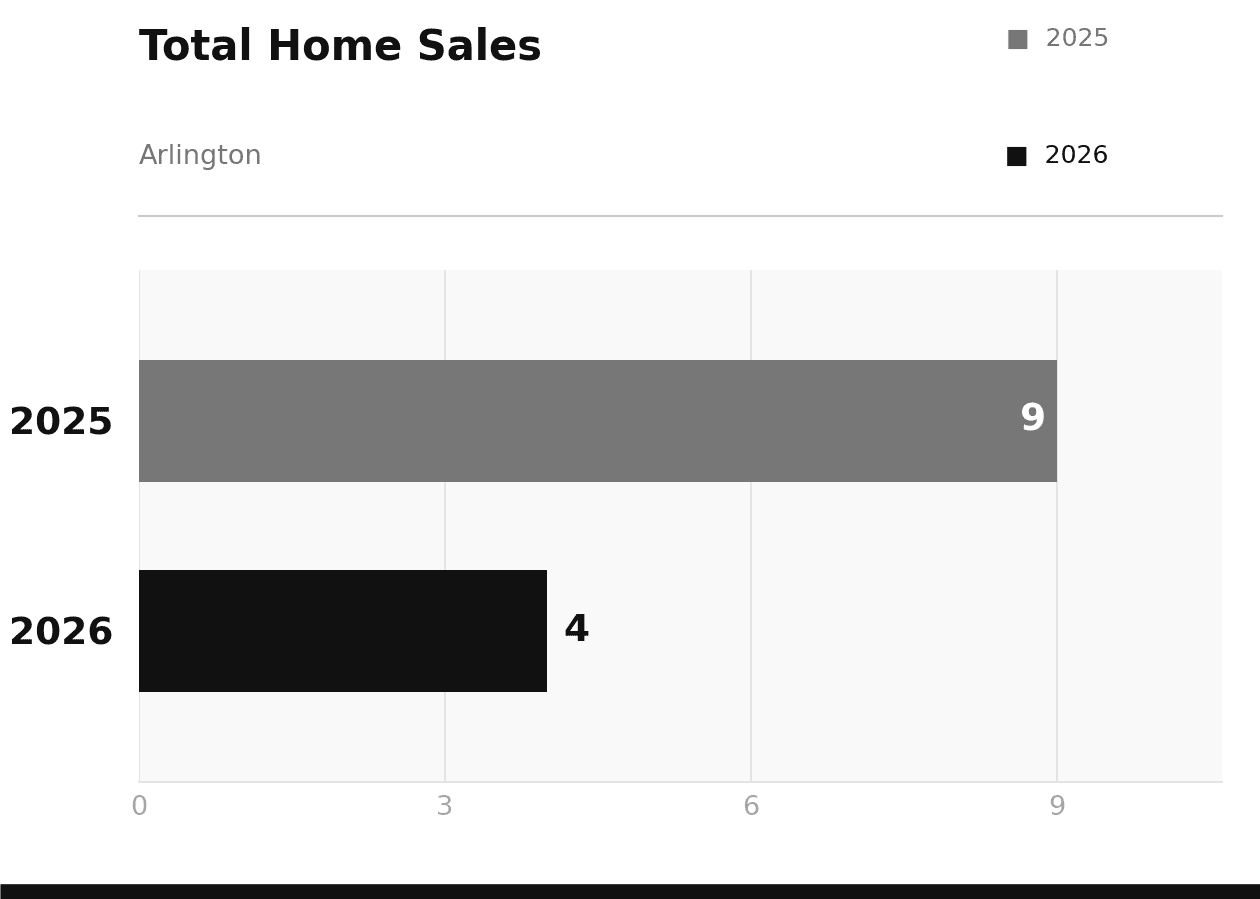
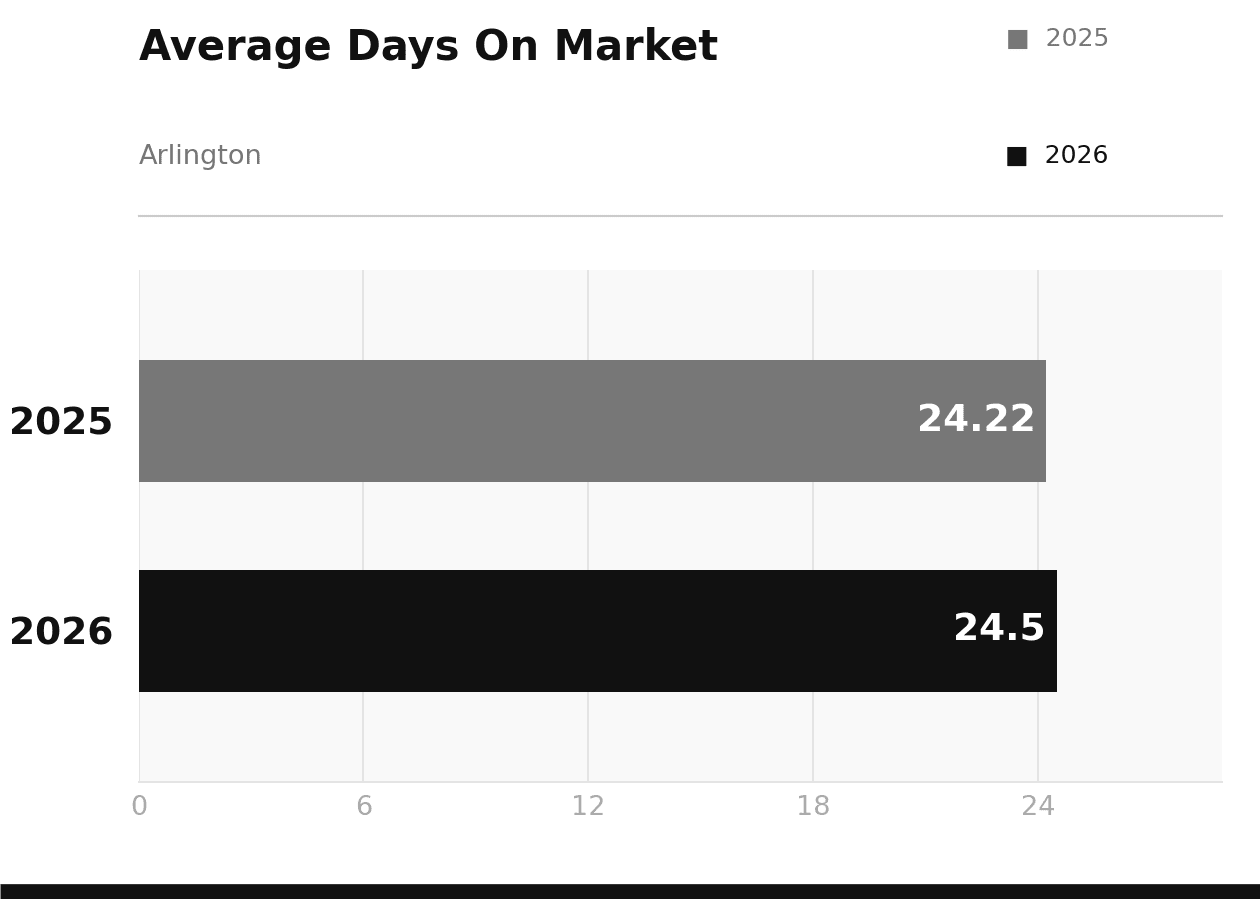
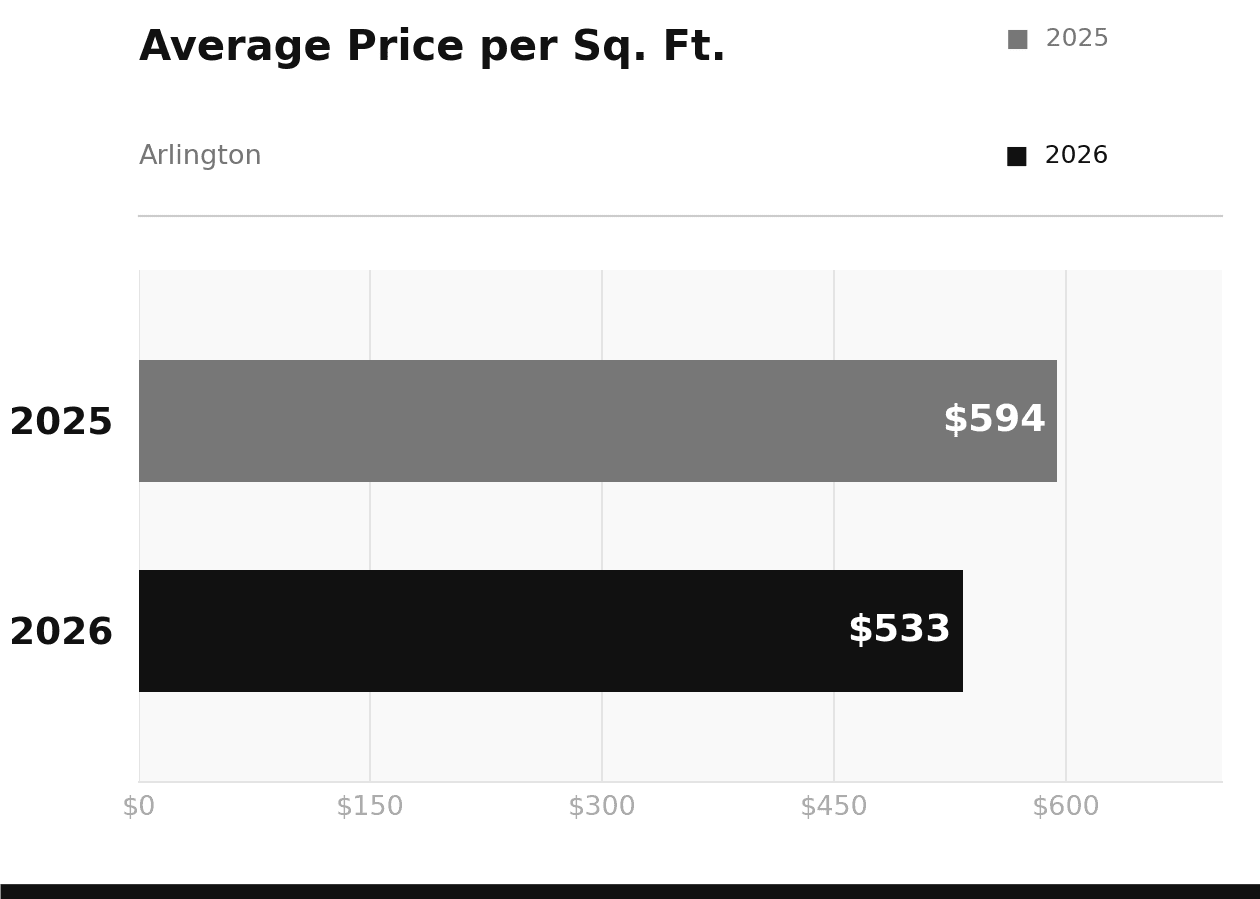
Arlington had a very thin February, with just 4 closings compared to 9 in February 2025. When that few homes trade hands, averages are highly sensitive to which specific properties sold. Average sale price dropped from $1,505,500 to $1,171,750, and price per square foot fell from $594 to $533. It would be a mistake to read too much into those numbers in a month where fewer than five homes closed. Days on market stayed nearly flat at 24 days, which suggests that the homes that did enter the market moved efficiently.
Arlington’s fundamentals remain solid. Its proximity to Cambridge and Boston continues to attract buyers, and the spring market typically tells a more complete story about where values are settling.
What does this mean for your home?
Whether you are thinking about selling or simply keeping an eye on the market, Sven and the team are happy to walk you through what these numbers mean for your specific situation.