

August 21, 2026 | Market Reports
Real Estate Market Update | August 2026

Price is where the three towns we track diverged this year: up sharply in Arlington, softer in Lexington and Winchester. Time on market rose in all three, though for different reasons in each. Here is how Arlington, Lexington, and Winchester have performed year-to-date against the same period in 2025.
Arlington
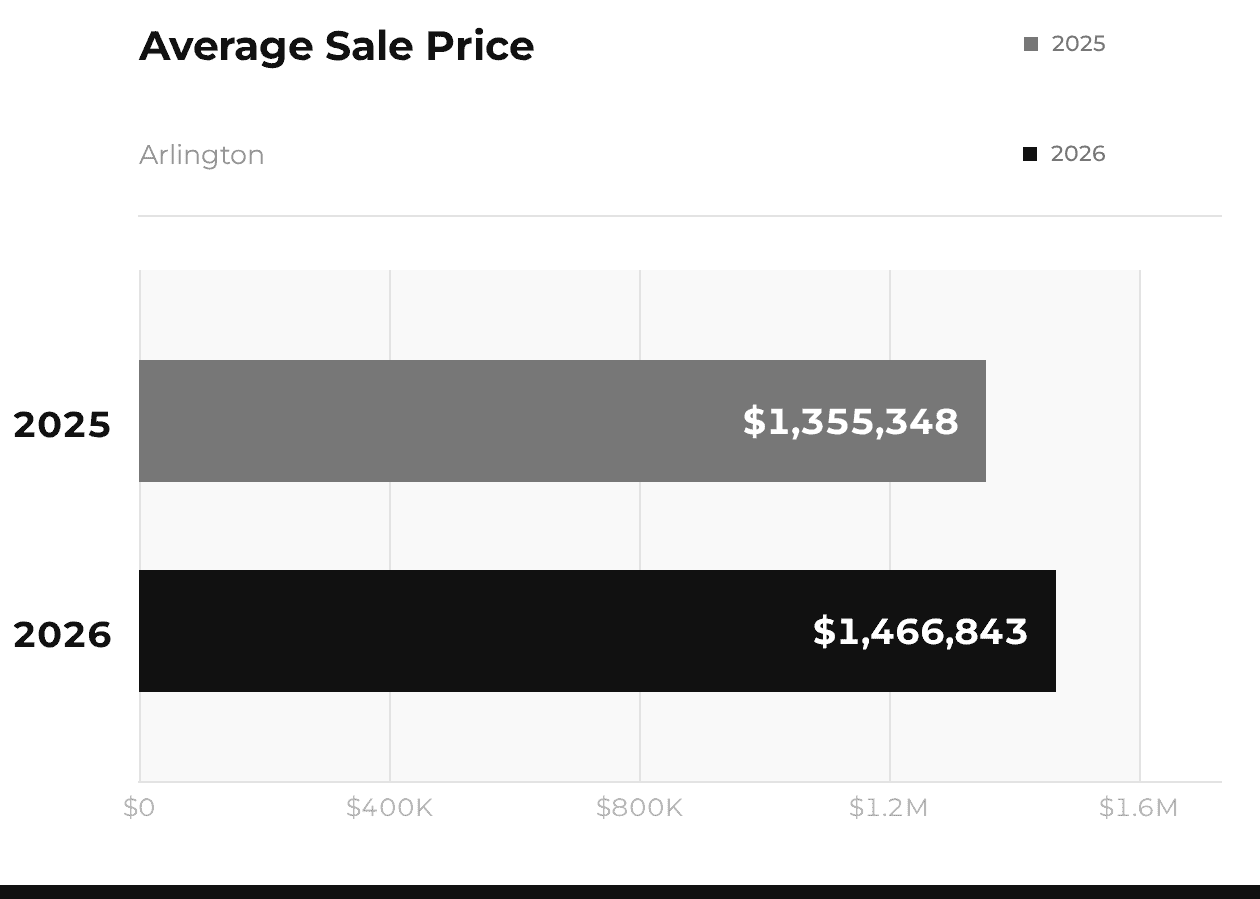
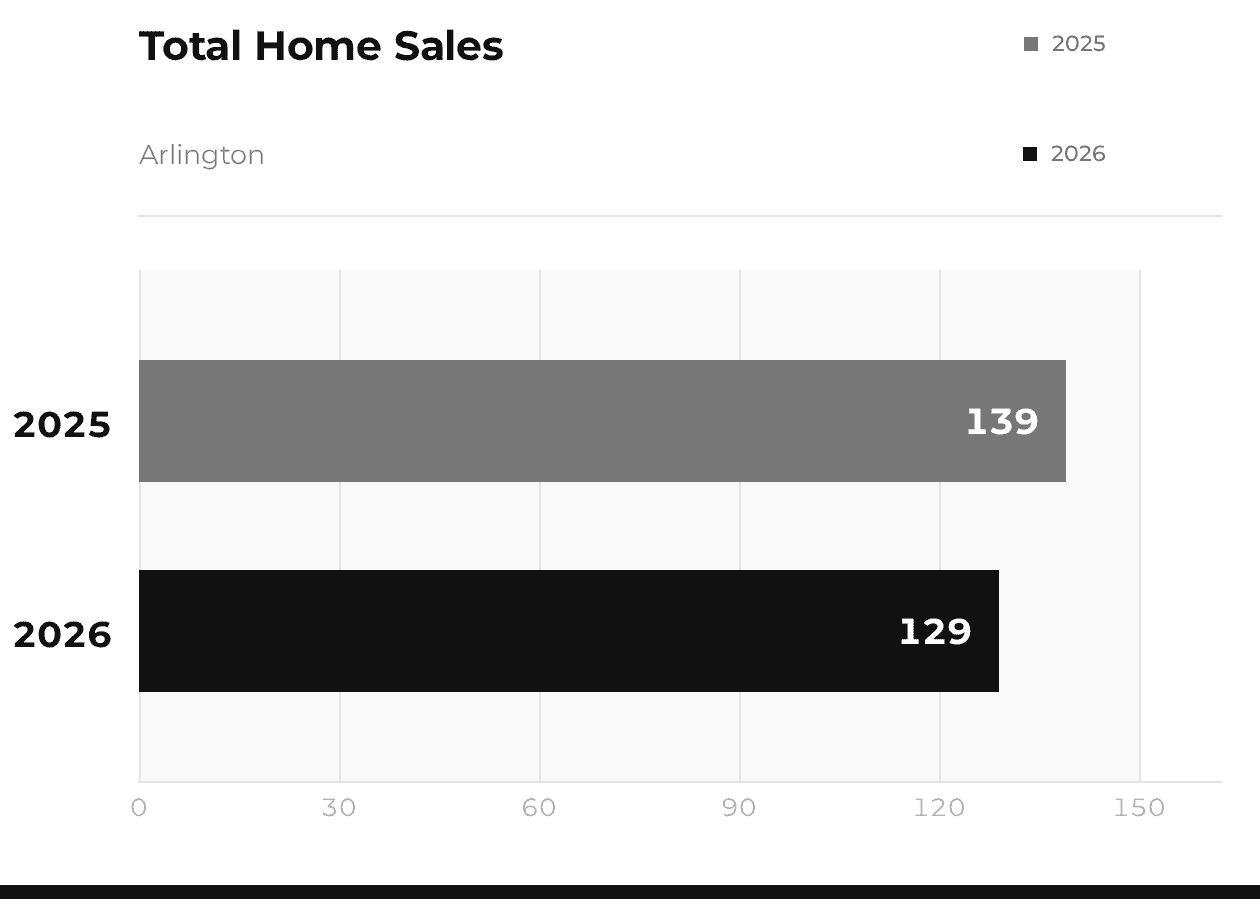
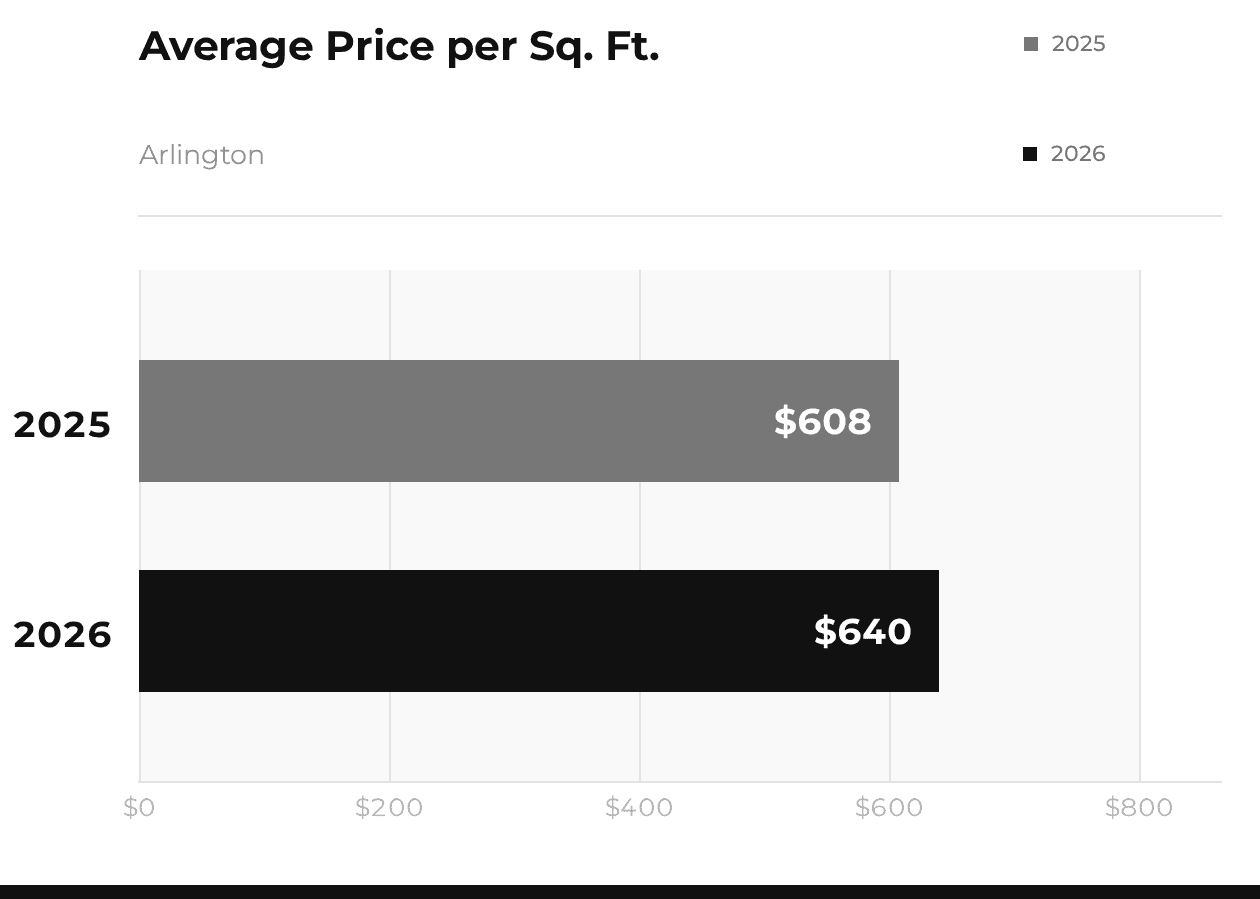
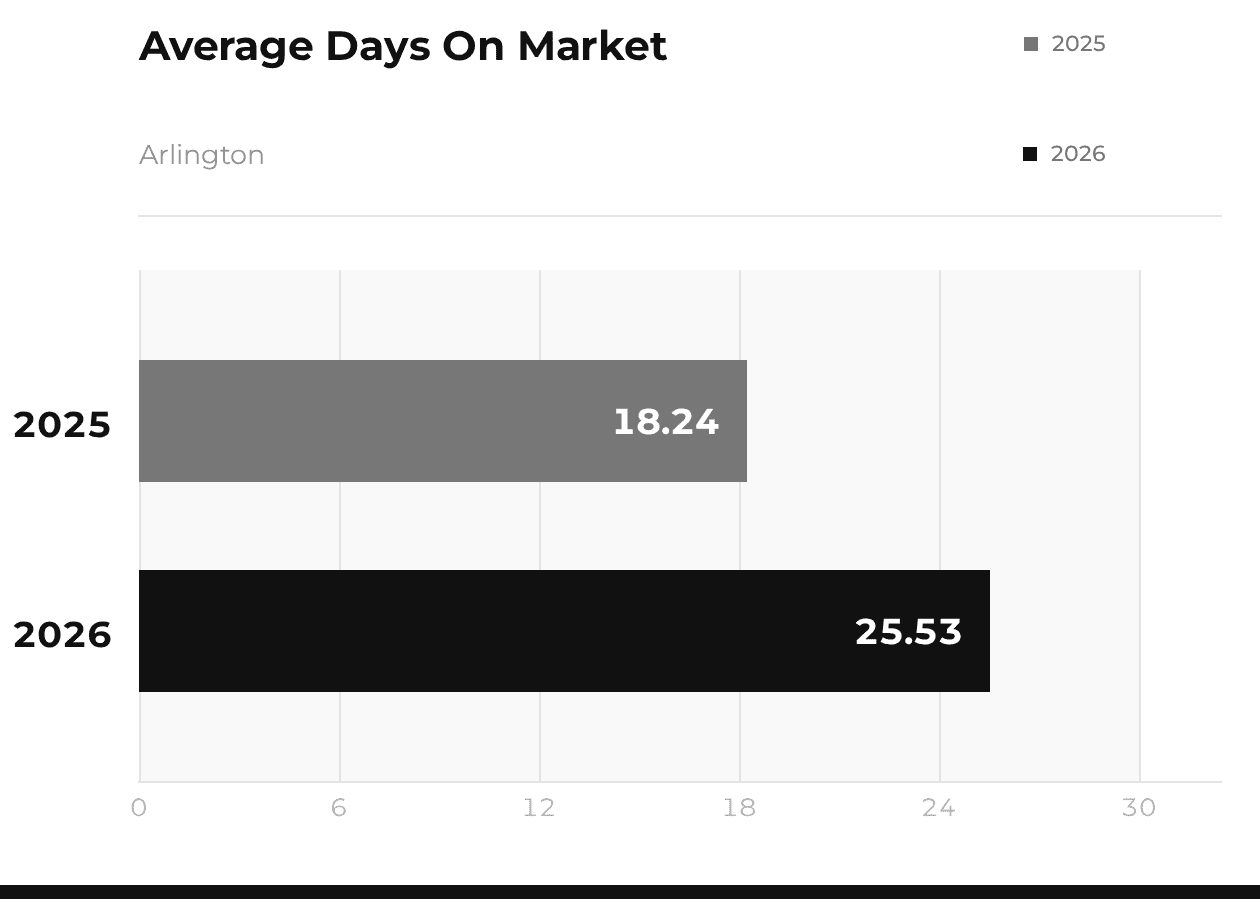
Arlington posted the strongest price growth of the three. The market recorded 129 sales year-to-date against 139 in 2025, with the average sale price climbing to $1,466,843 from $1,355,348. Price per square foot rose from $608 to $640, confirming that the gain reflects genuine appreciation rather than a handful of larger homes changing hands. Homes averaged 26 days on market, up from 18 — a meaningful shift, though Arlington still turns over faster than either of its neighbors.
Lexington
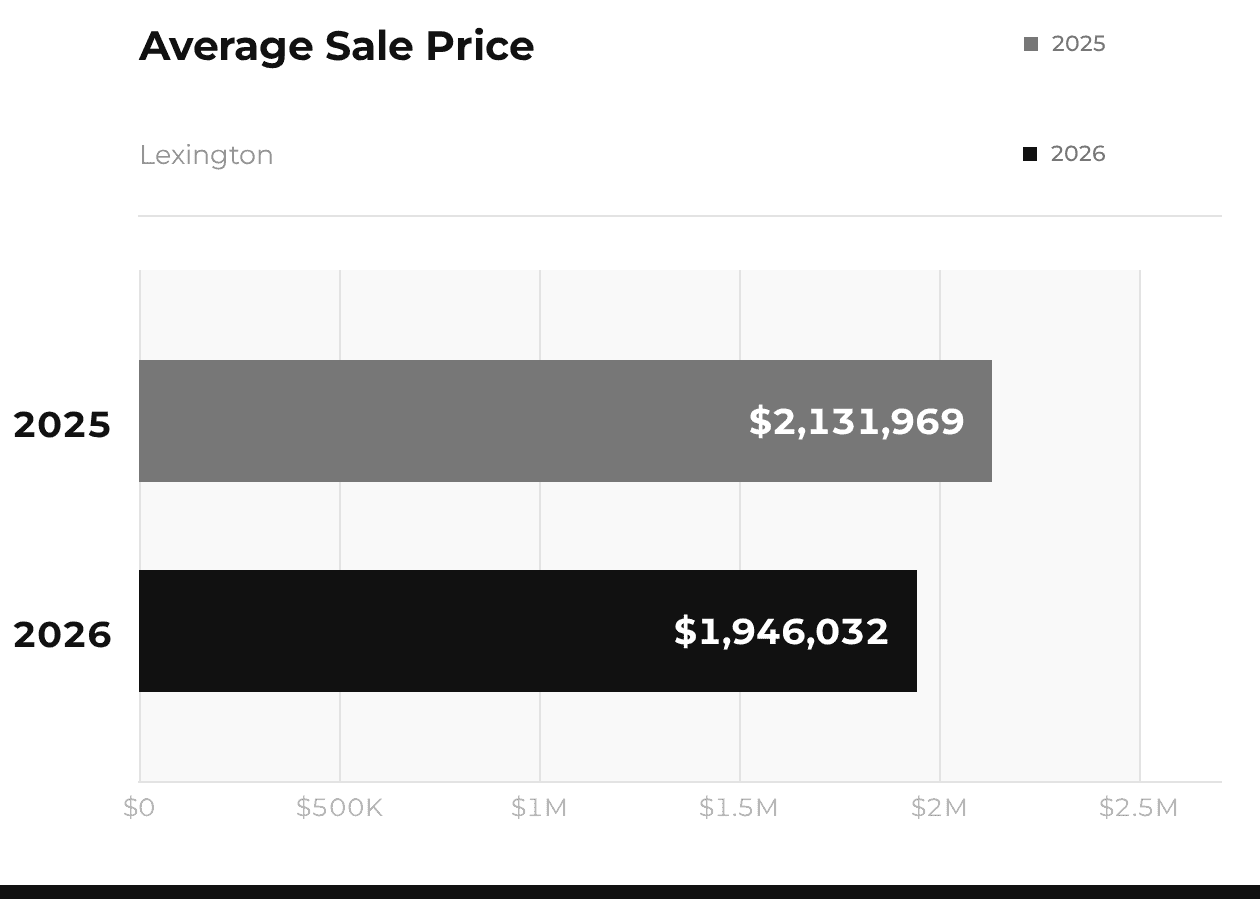
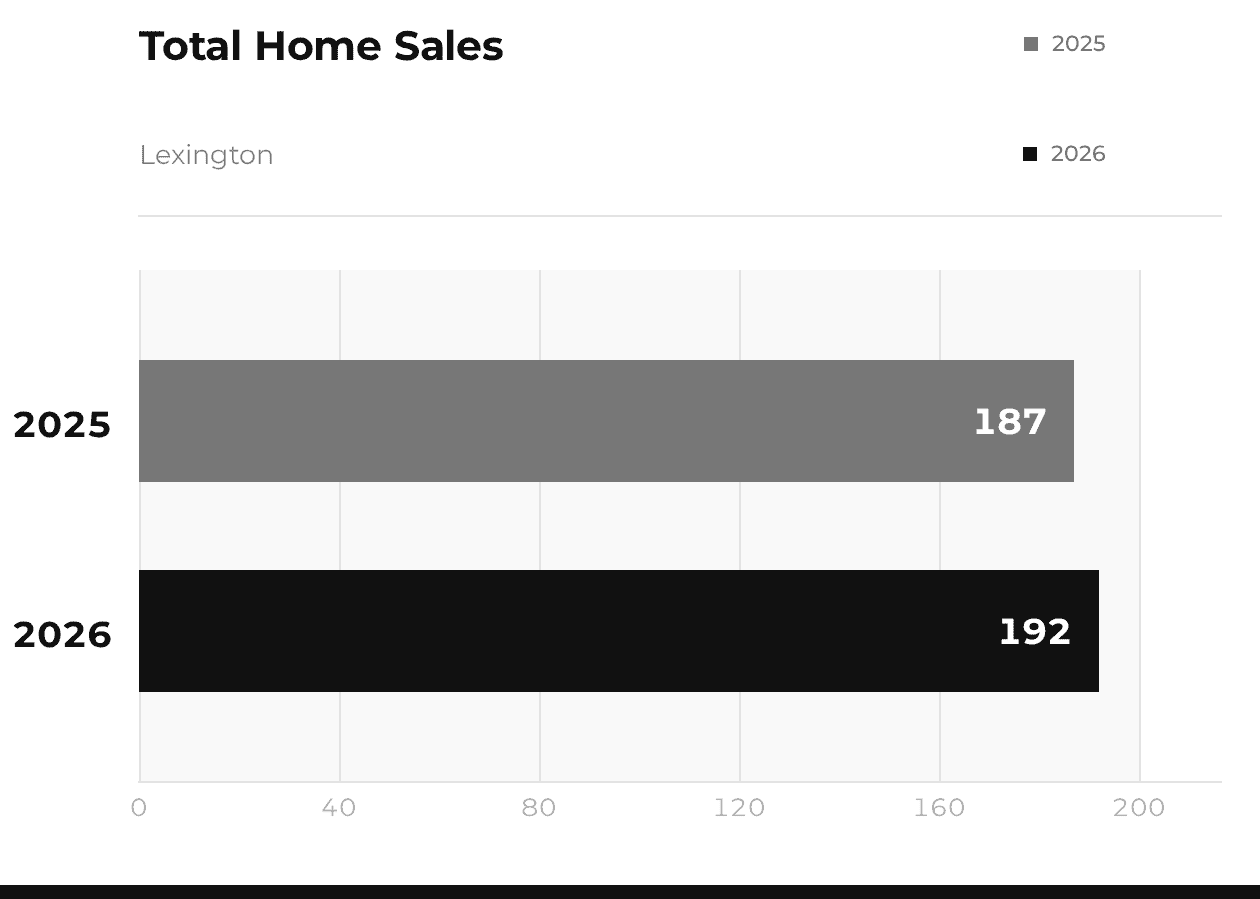
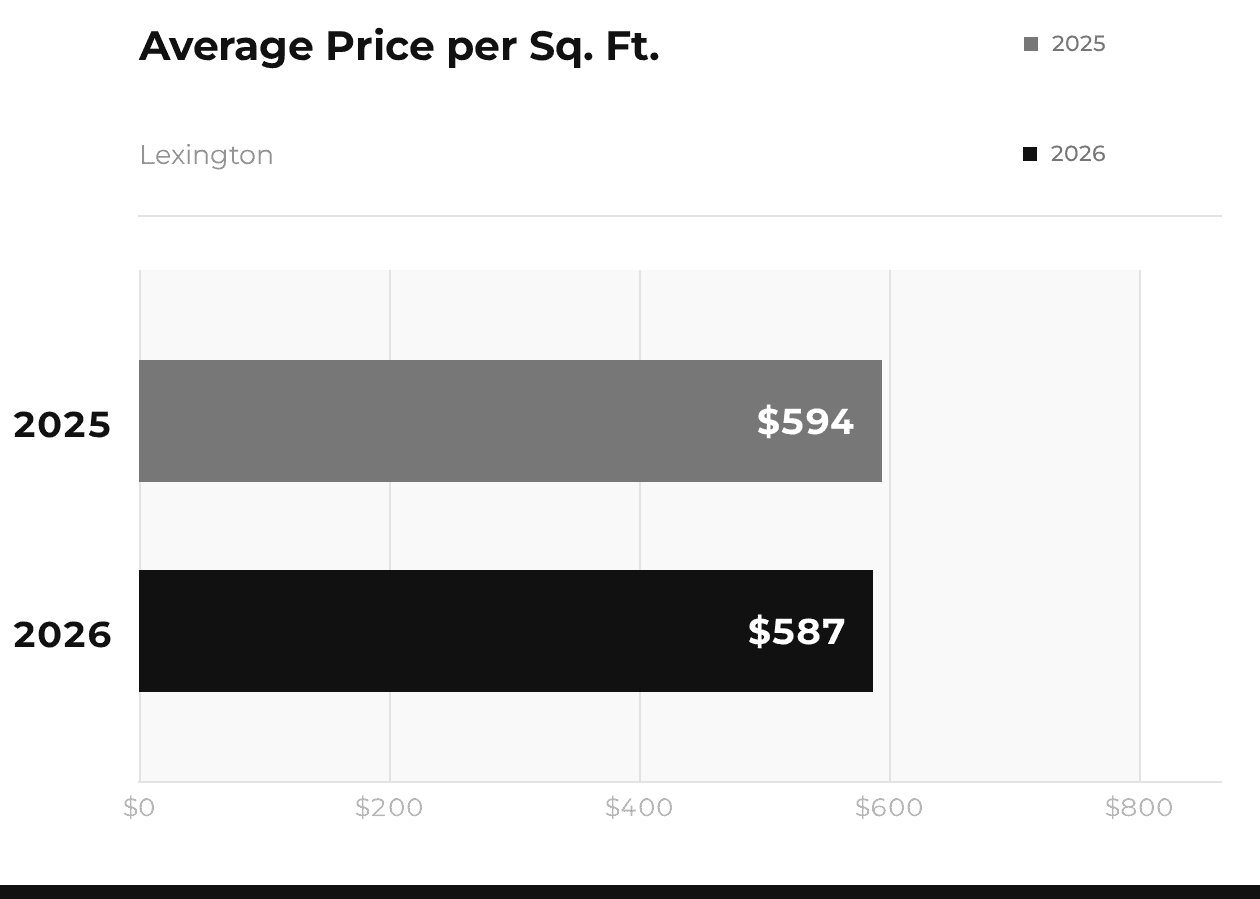
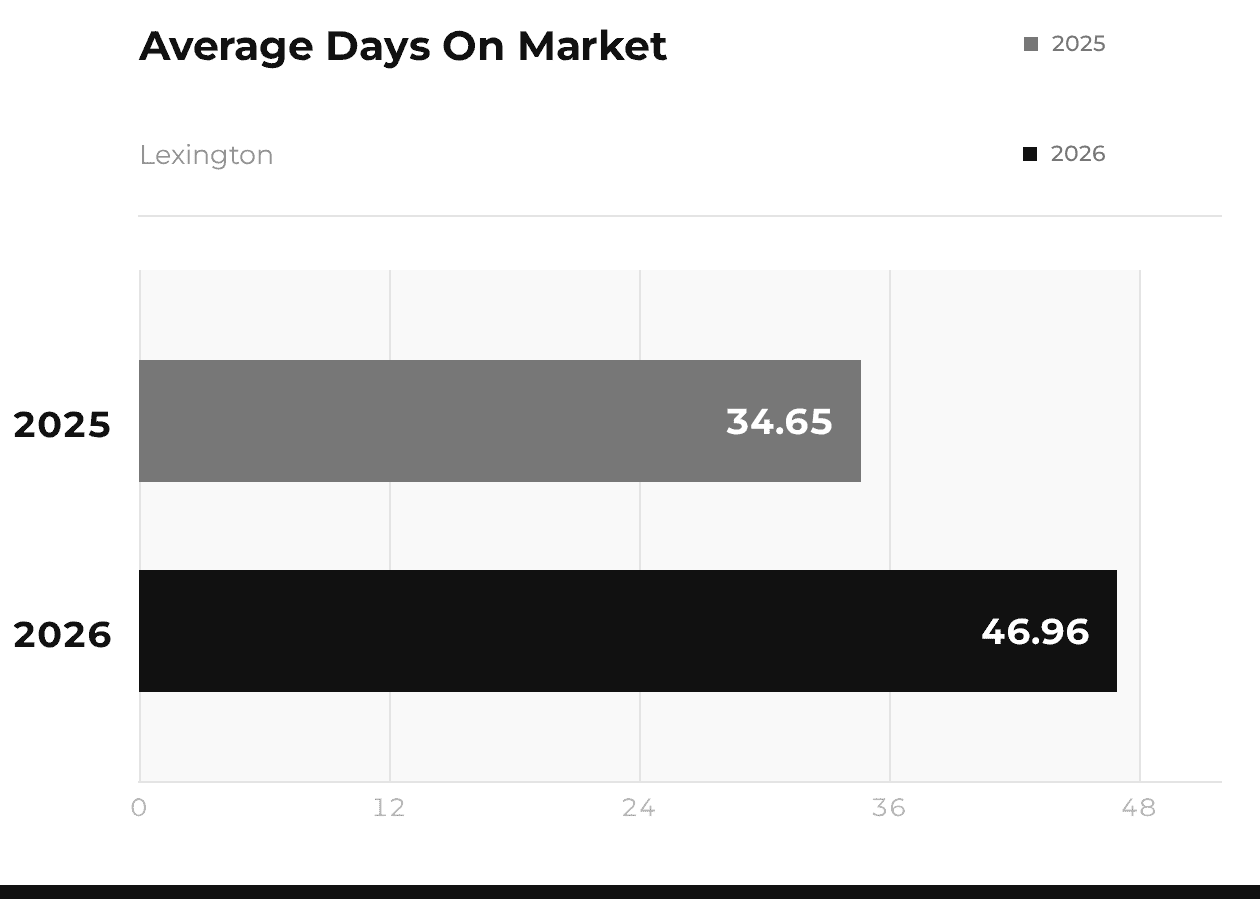
Lexington remains the busiest of the three markets, with 192 homes sold compared with 187 a year ago. The average sale price came in at $1,946,032, down from $2,131,969, though price per square foot held nearly flat at $587 against $594 — a broader mix of homes selling rather than a drop in demand. Days on market jumped to 47 from 35, but that is a backlog clearing rather than a slowdown: a cluster of long-unsold homes finally closed this summer, pulling the average up on its own. Well-priced Lexington homes are still moving at close to last year’s pace.
Winchester
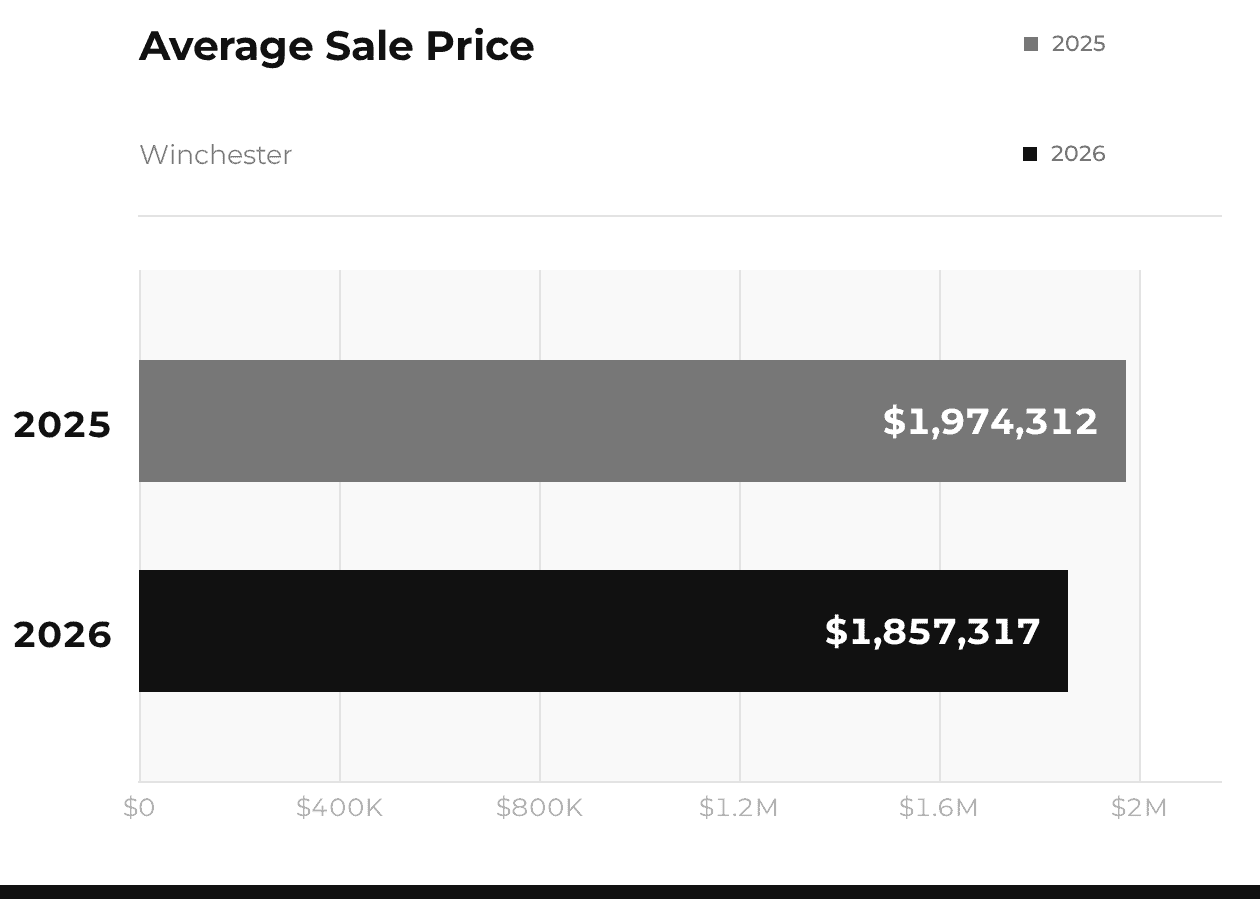
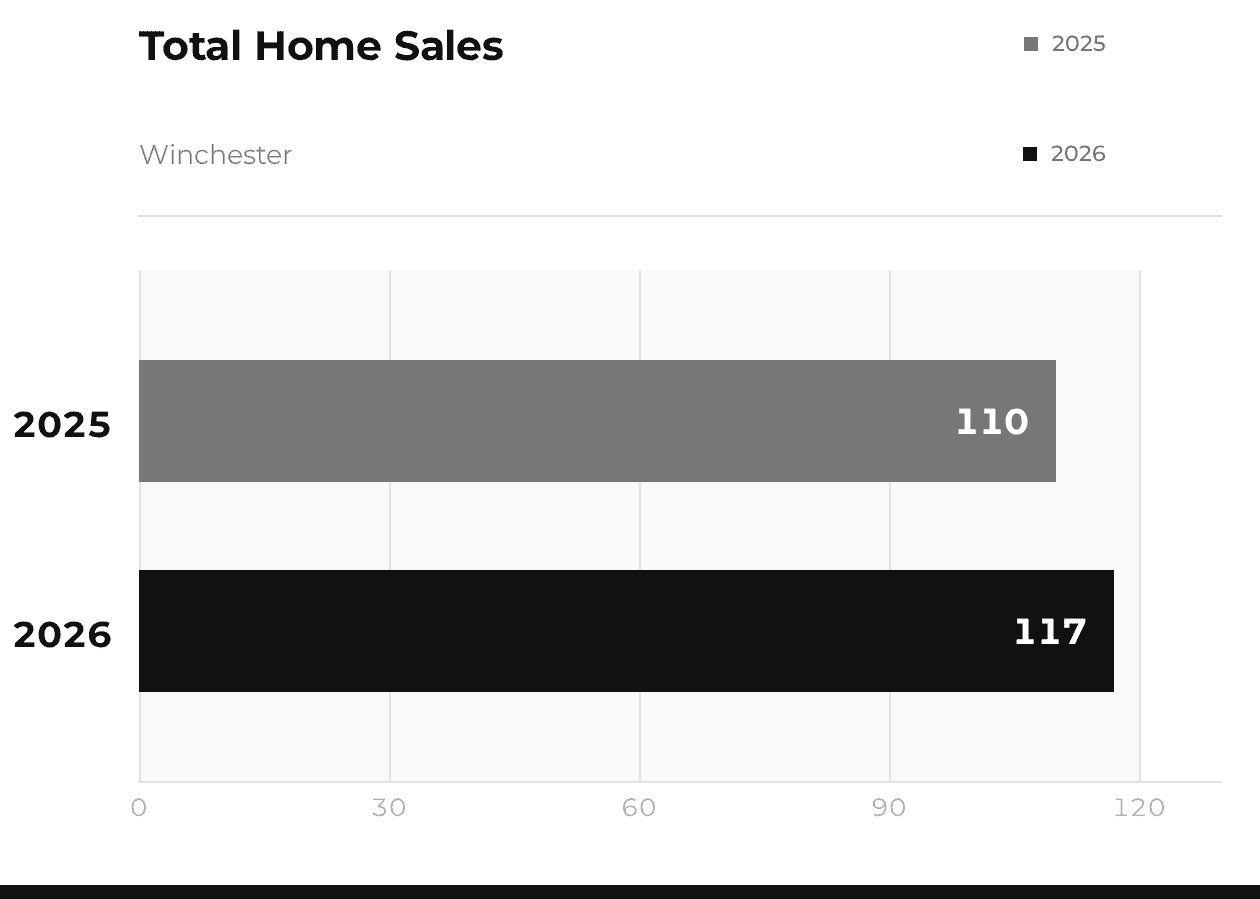
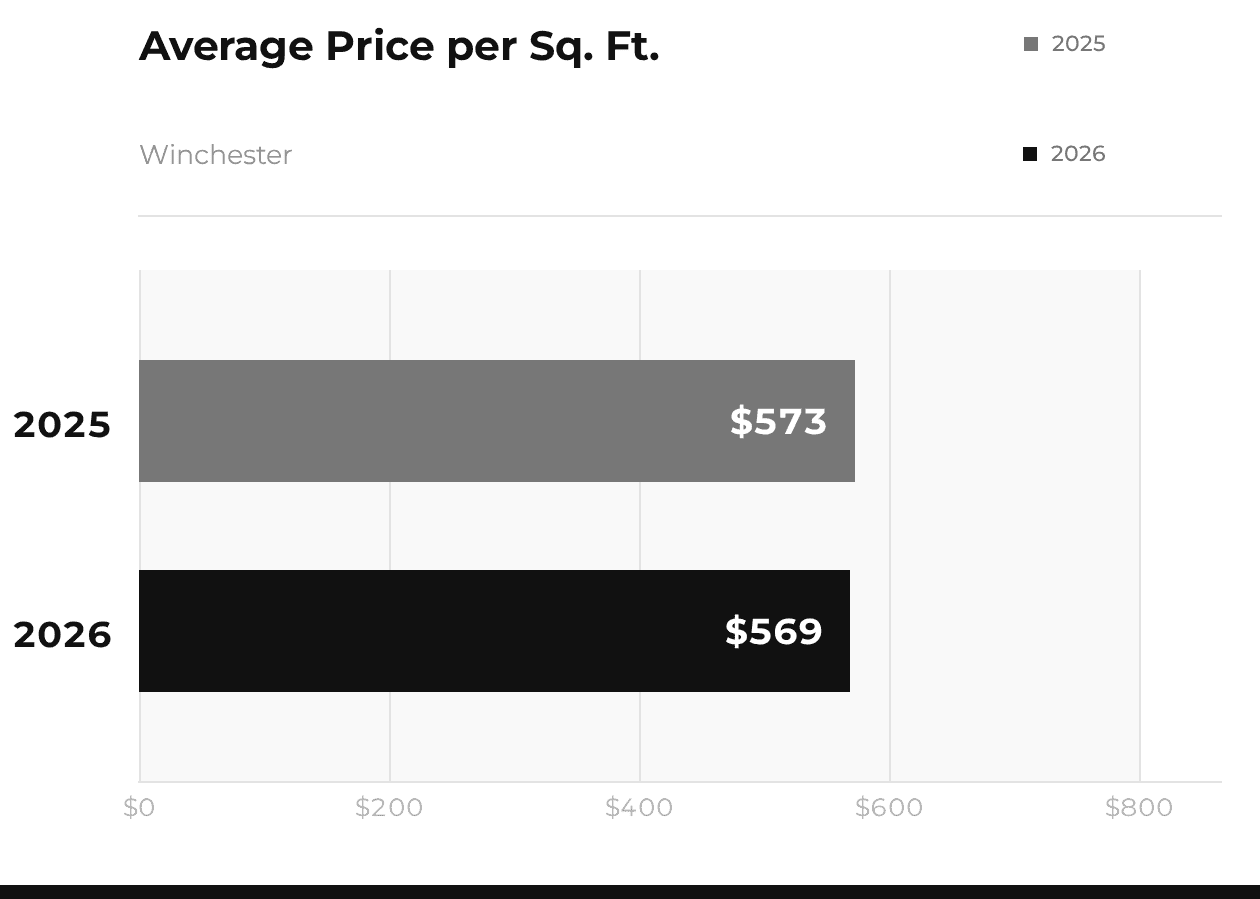
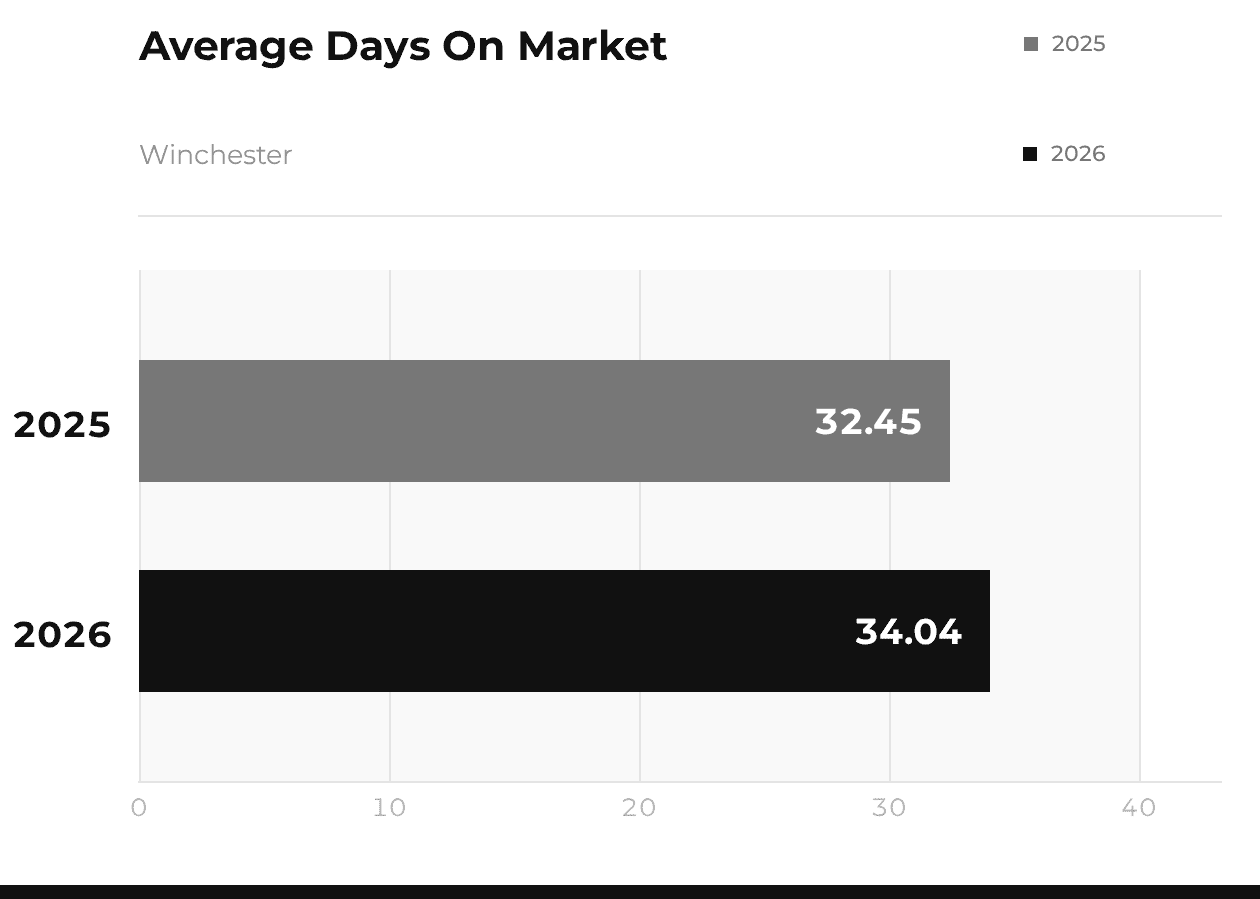
Winchester was the steadiest market of the three this month. Sales rose to 117 from 110, while the average sale price eased to $1,857,317 from $1,974,312. Price per square foot was essentially unchanged at $569 against $573, and days on market moved only slightly, to 34 from 32. More homes selling, at a stable per-foot value, with almost no change in how long they take — Winchester continues to behave like one of the most reliably sought-after markets north of Boston.
What does this mean for your home?
Averages describe a town, not a house. Whether a stronger per-foot figure in Arlington or a steadier picture in Winchester actually affects what your home would sell for depends on its street, its condition, and what else is competing with it right now. If you are weighing a move this fall, we are happy to talk through what these numbers mean for your specific situation.