

September 18, 2026 | Market Reports
Real Estate Market Update | September 2026

We’ve added two towns to the report this month, Medford and Reading. That brings our coverage of the North of Boston real estate market to five. Homes are sitting longer before they sell in every one of them, though the number actually selling varies quite a bit from town to town. All figures below cover January 1 through September 16, 2026, measured against the same stretch in 2025.
At a glance. Year-to-date figures for January 1 through September 16, 2026, with the same period in 2025 shown in parentheses.
| Town | Homes sold | Average sale price | Price per sq. ft. | Days on market |
|---|---|---|---|---|
| Arlington | 144 (156) | $1,444,300 ($1,330,248) | $636 ($612) | 26 (18) |
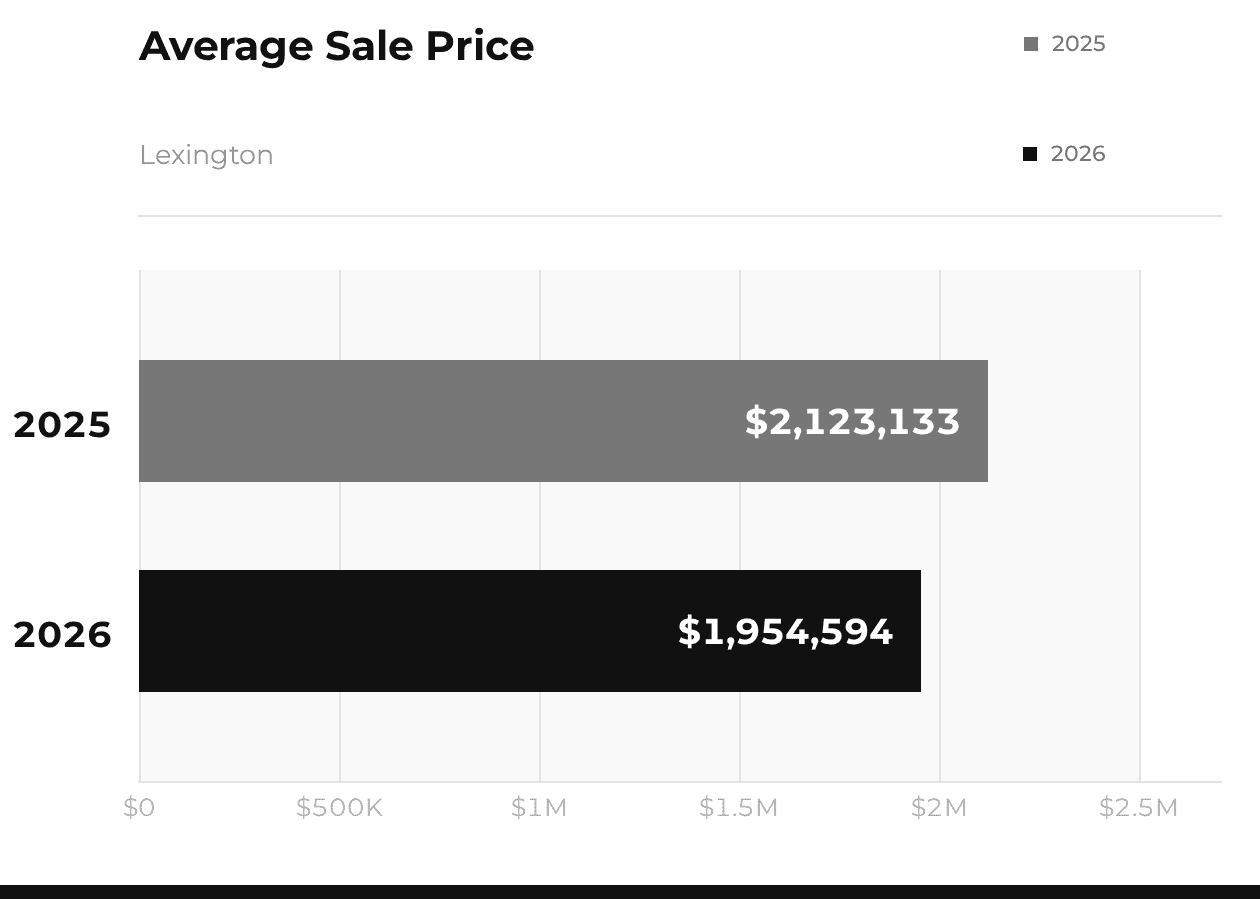
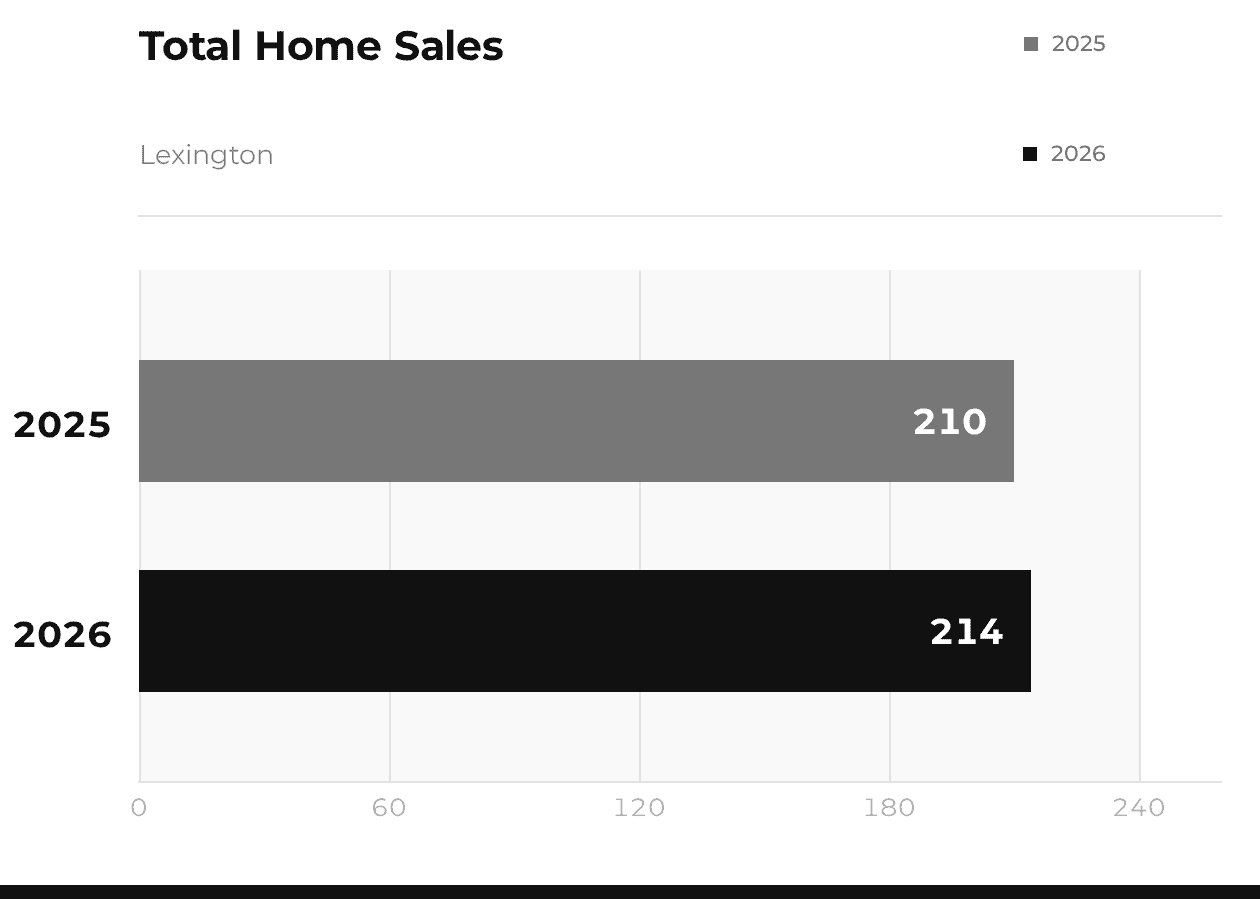
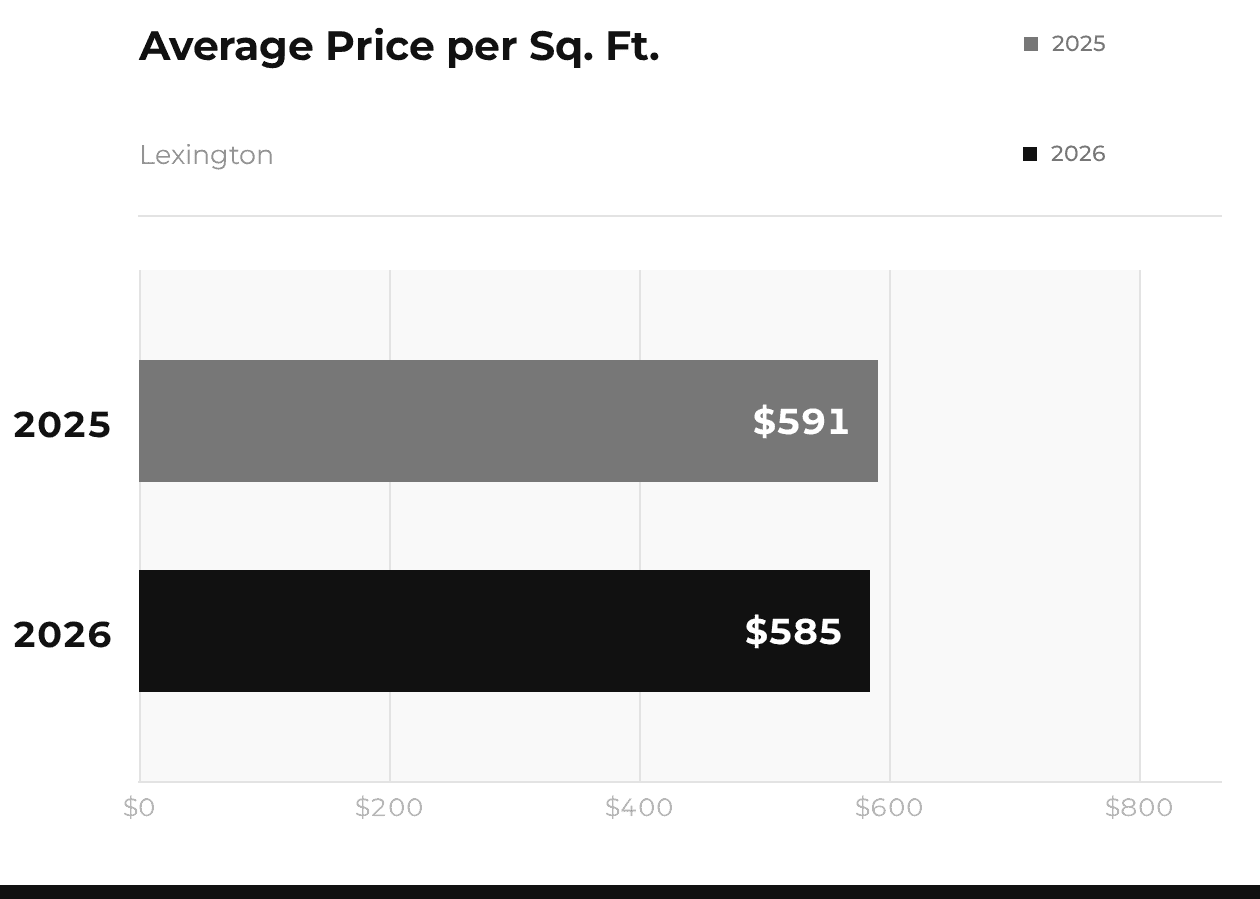
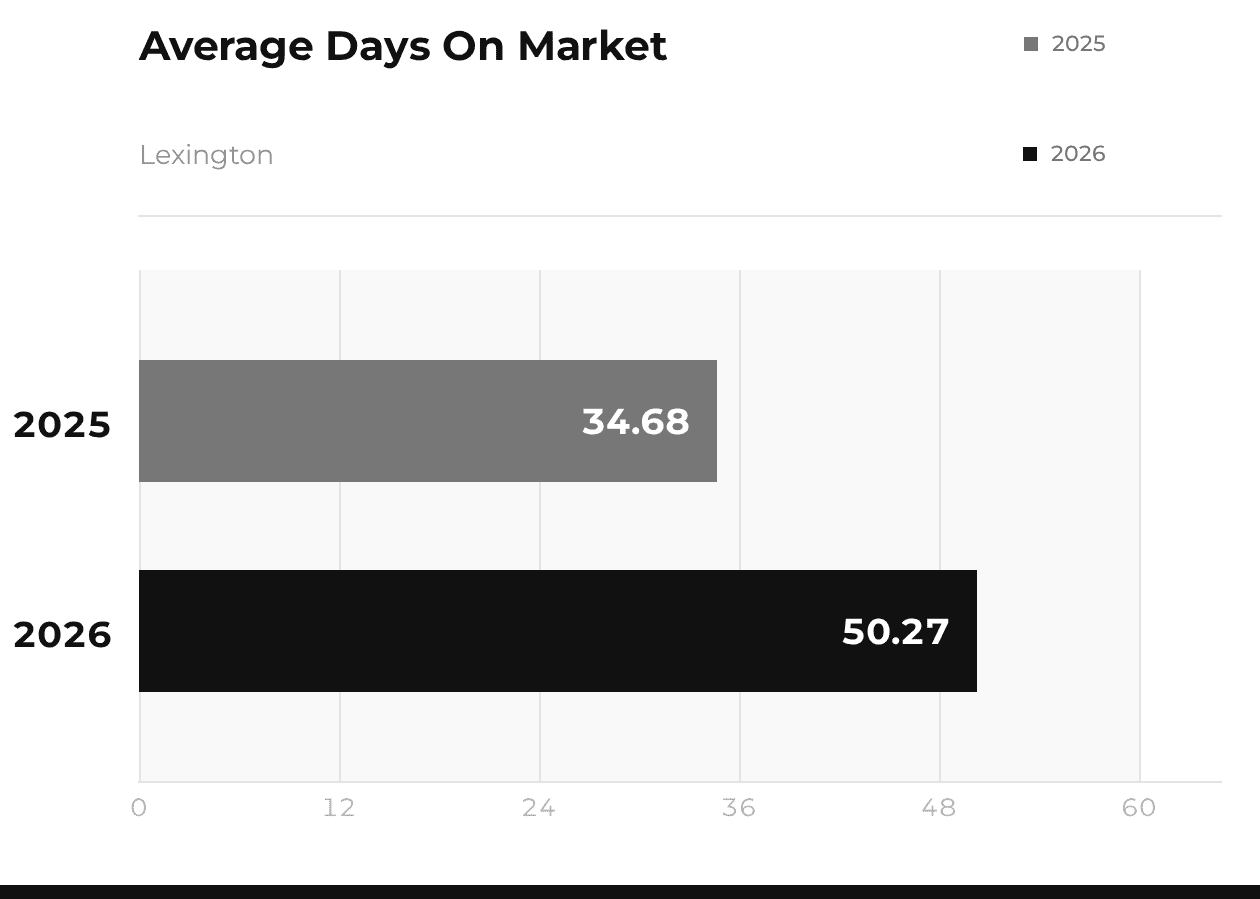
| Lexington | 214 (210) | $1,954,594 ($2,123,133) | $585 ($591) | 50 (35) |
| Medford | 144 (169) | $991,276 ($980,892) | $510 ($498) | 31 (27) |
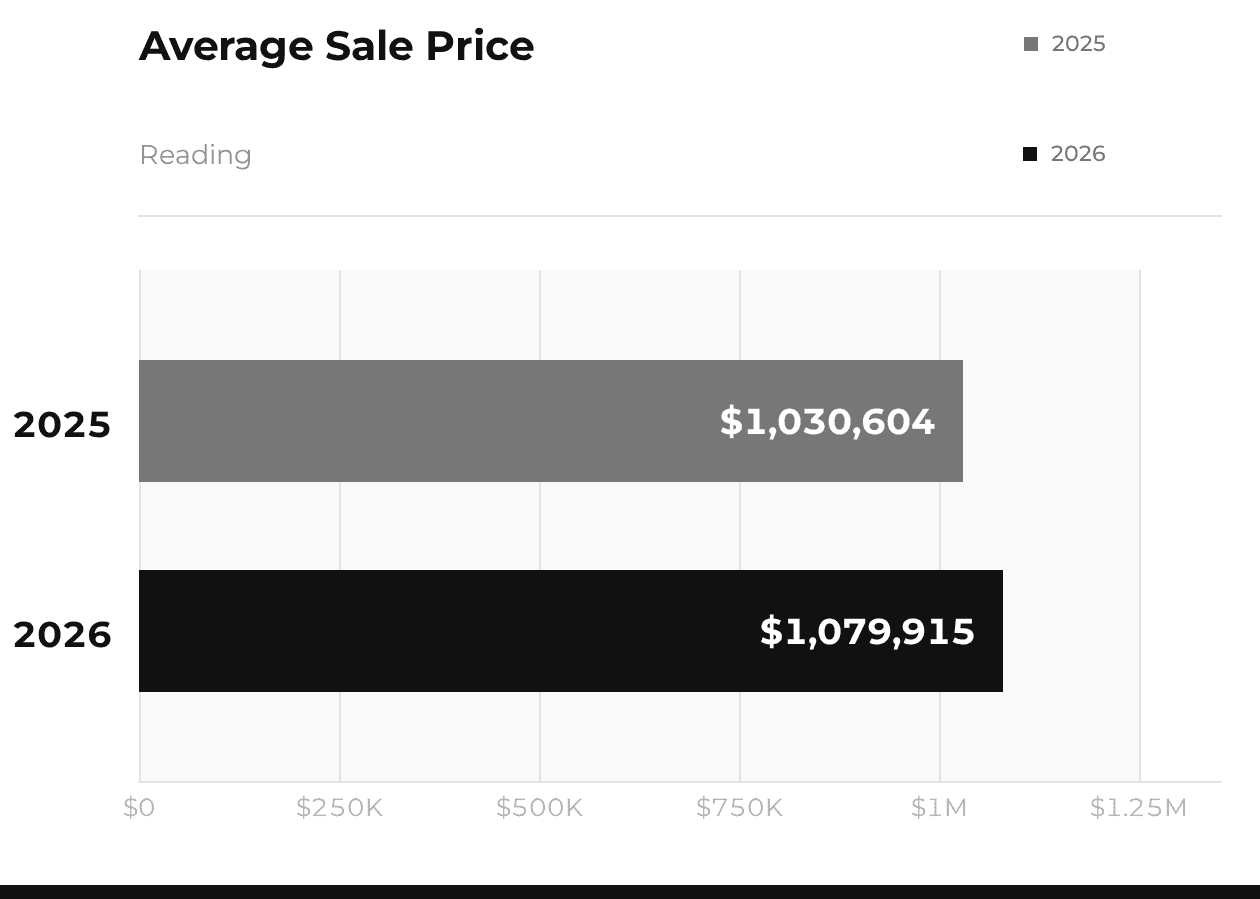
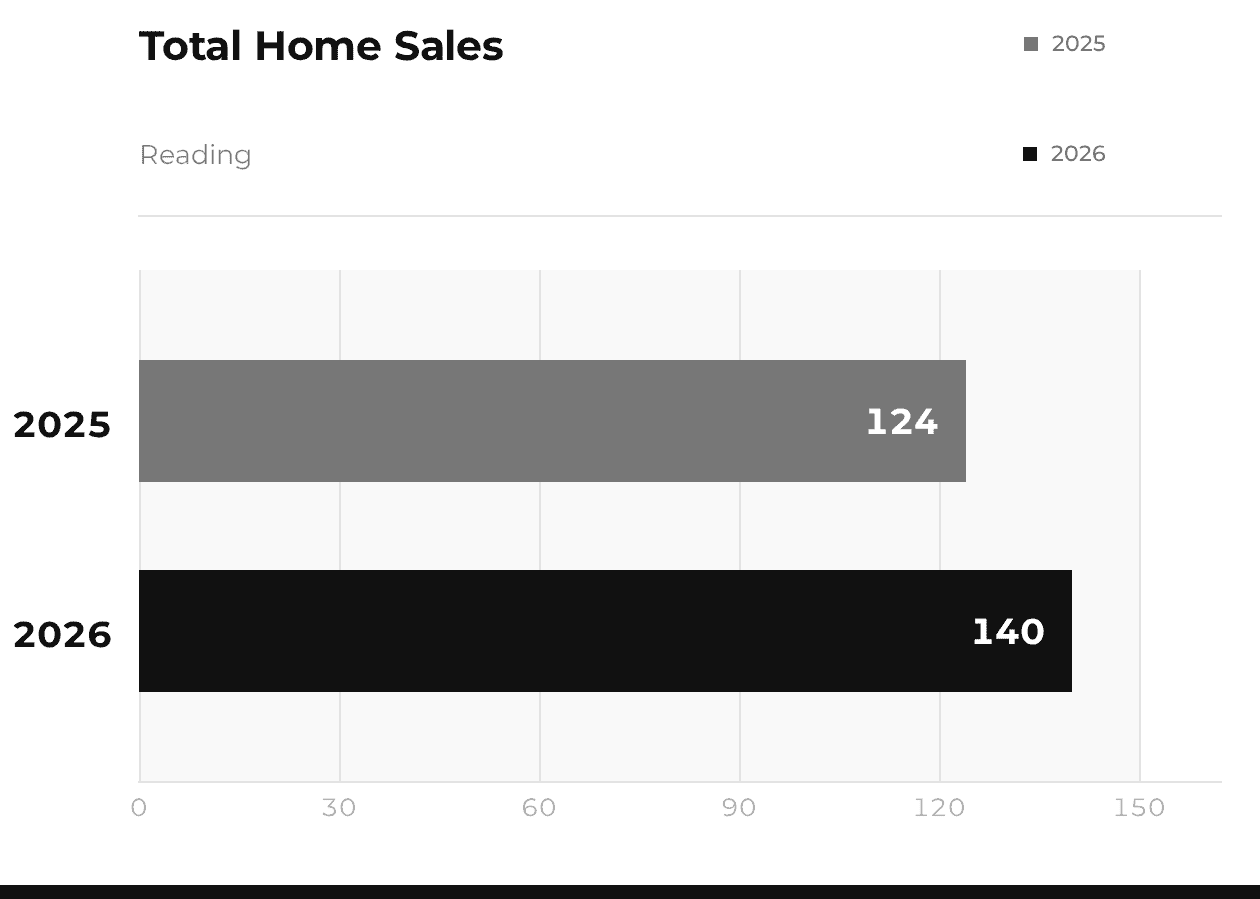
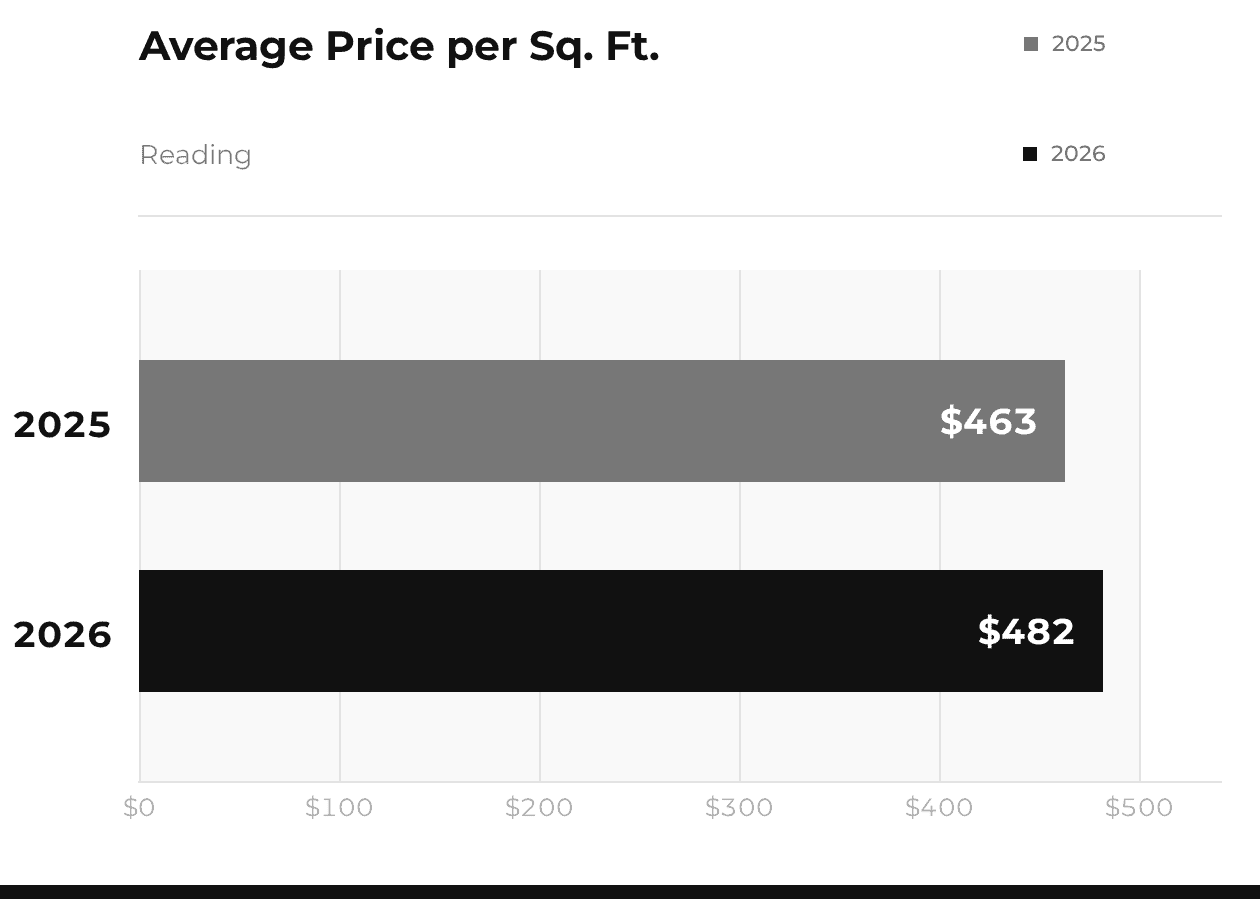
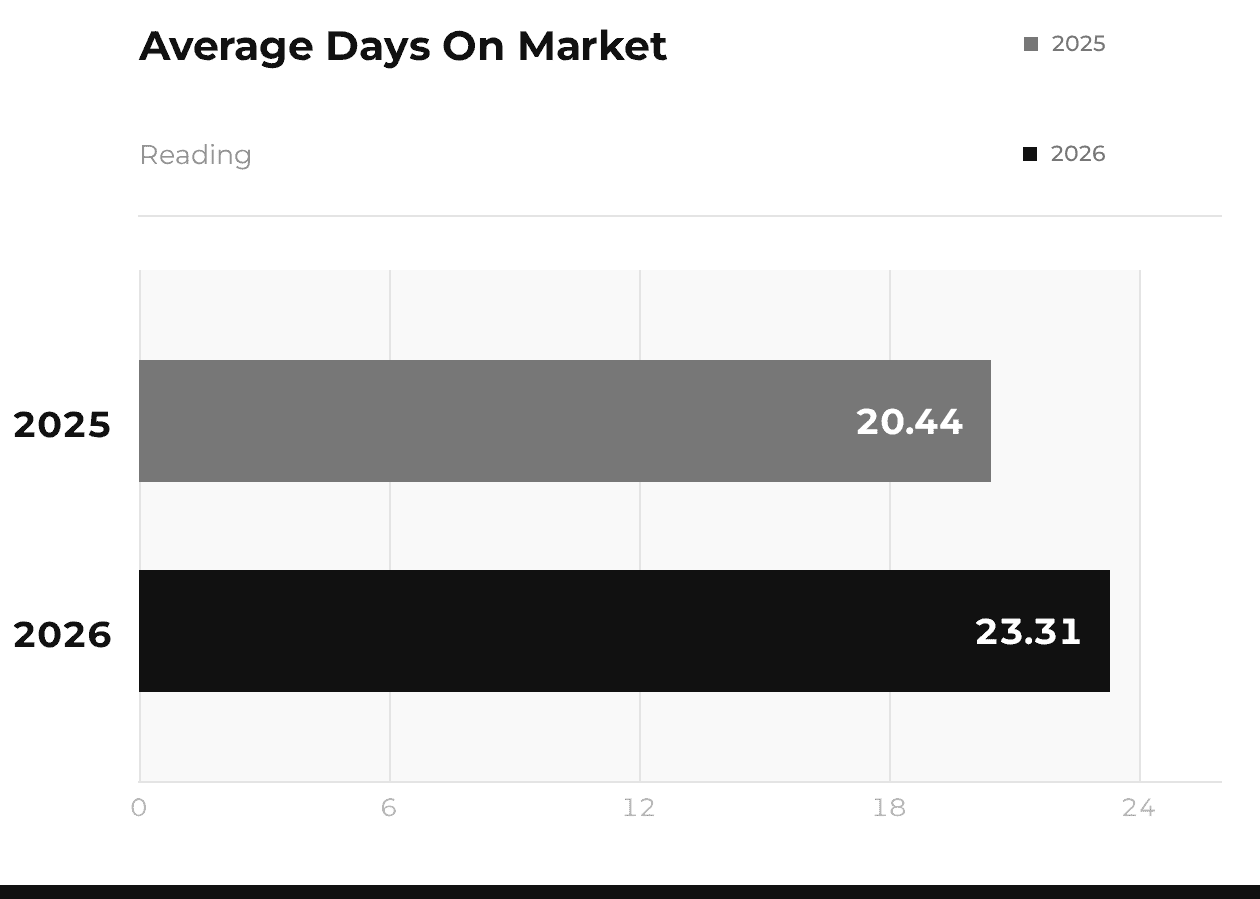
| Reading | 140 (124) | $1,079,915 ($1,030,604) | $482 ($463) | 23 (20) |
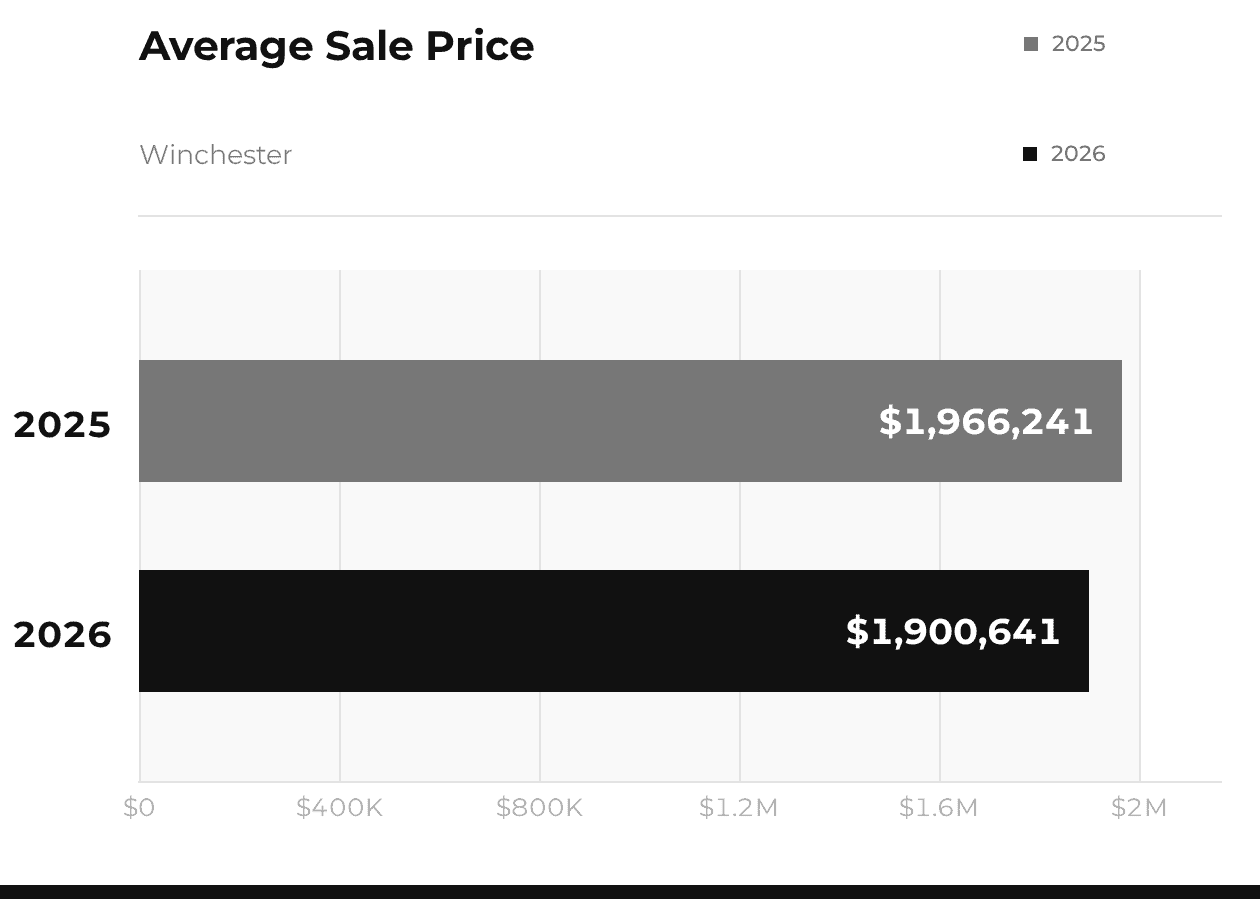
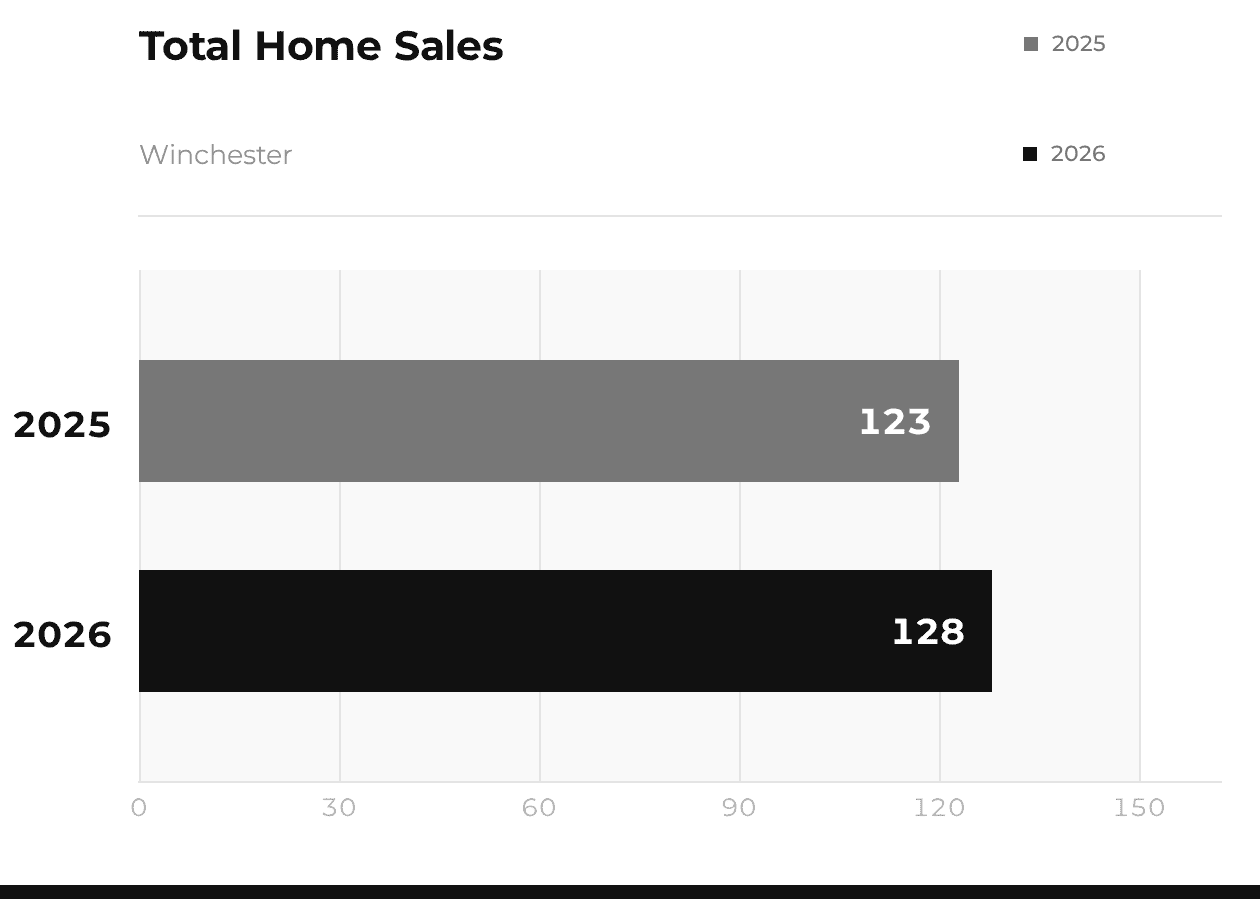
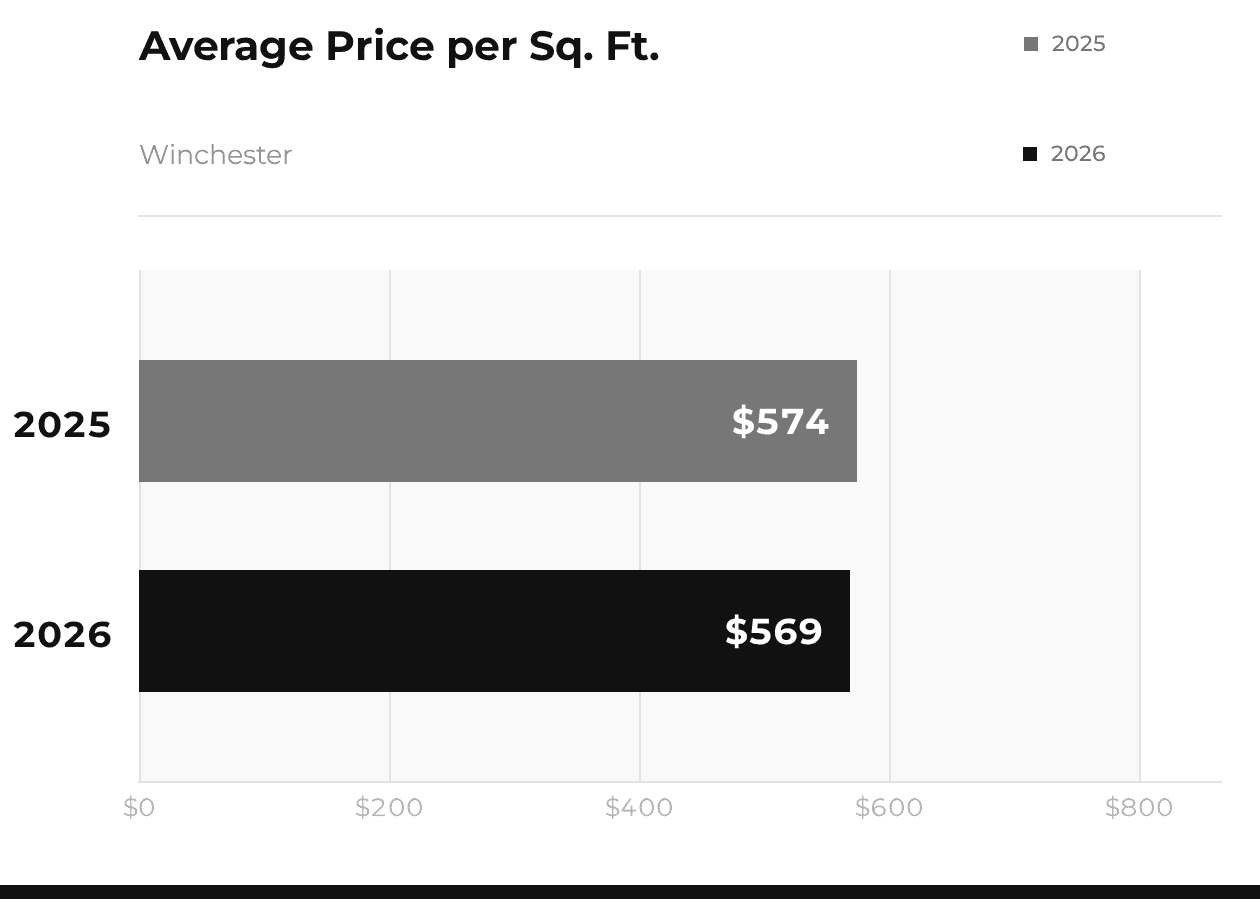
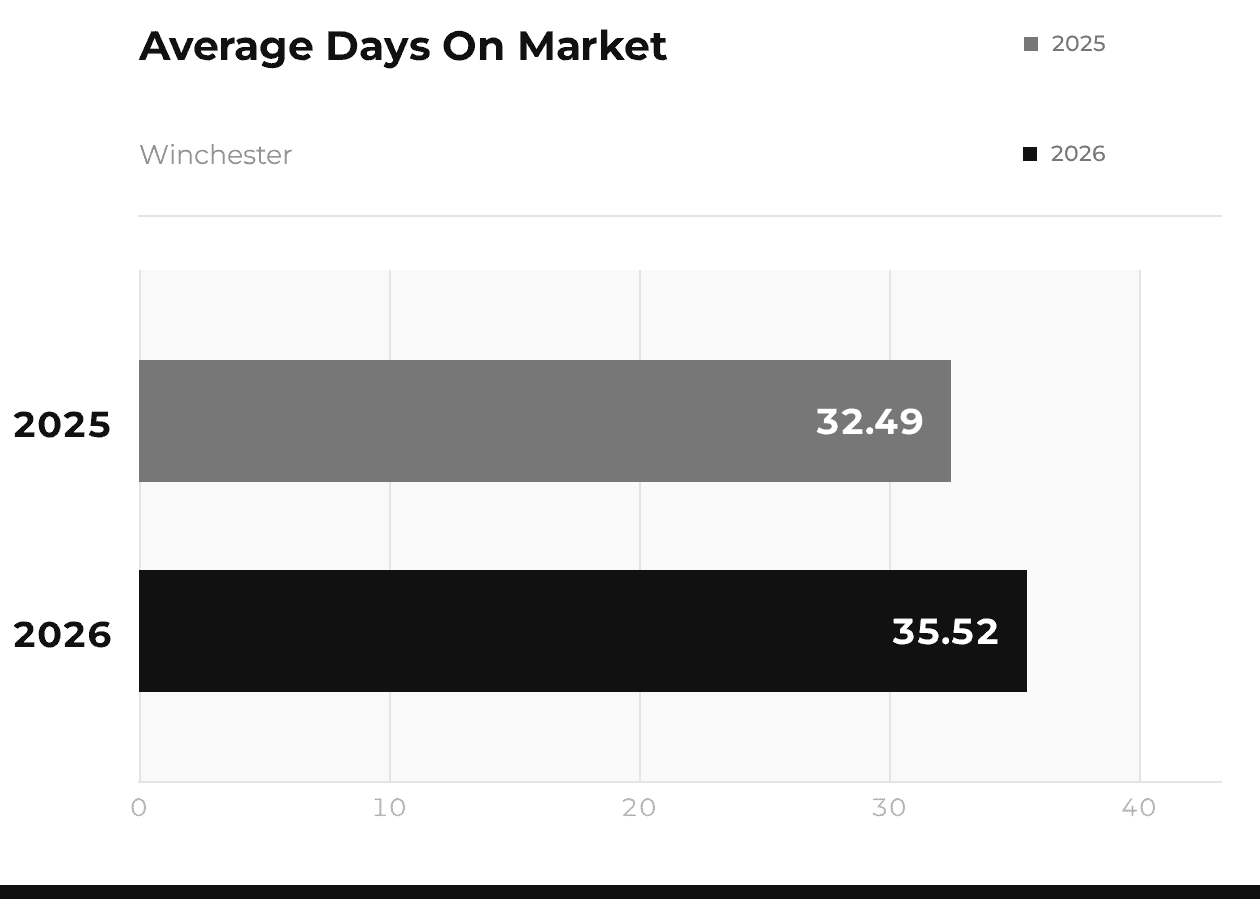
| Winchester | 128 (123) | $1,900,641 ($1,966,241) | $569 ($574) | 36 (32) |
Arlington
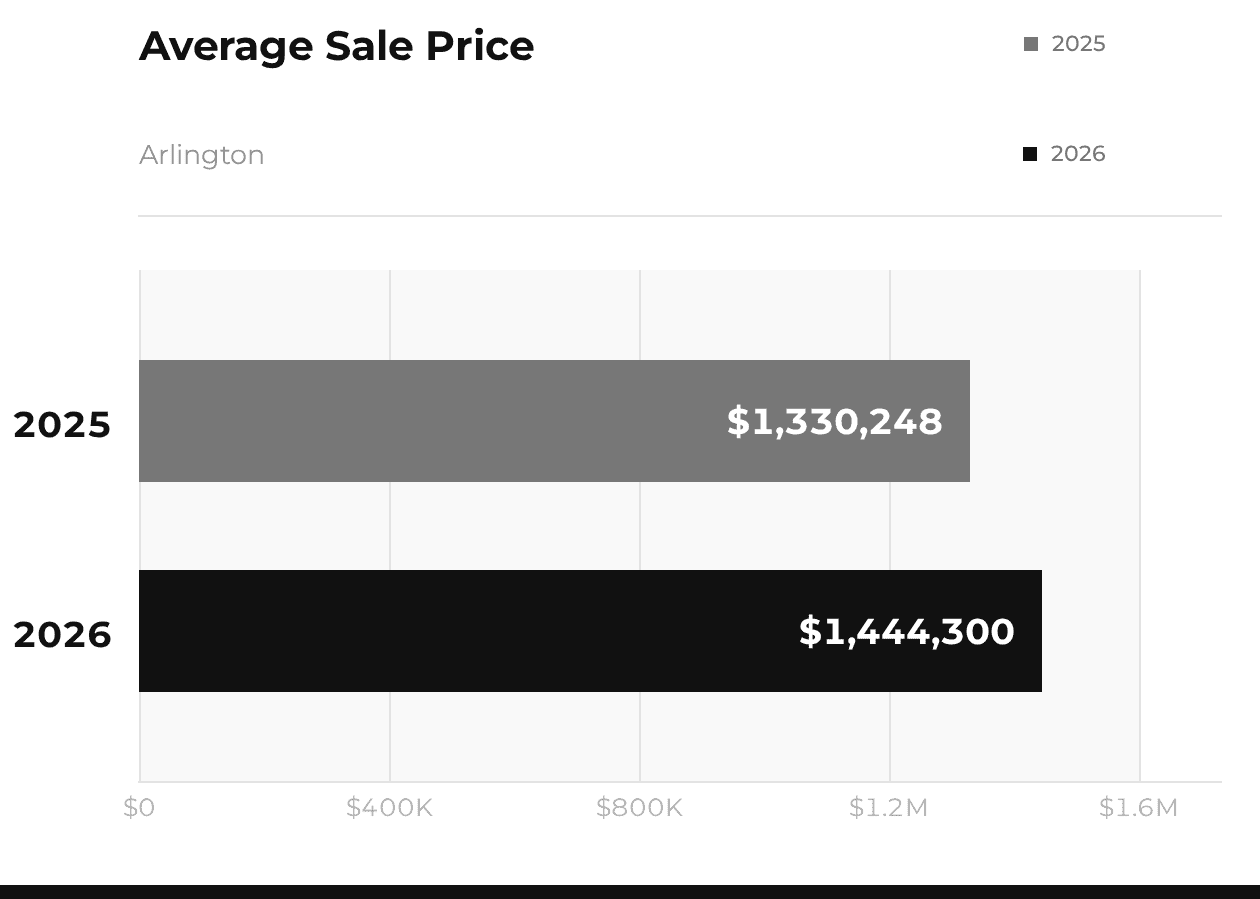
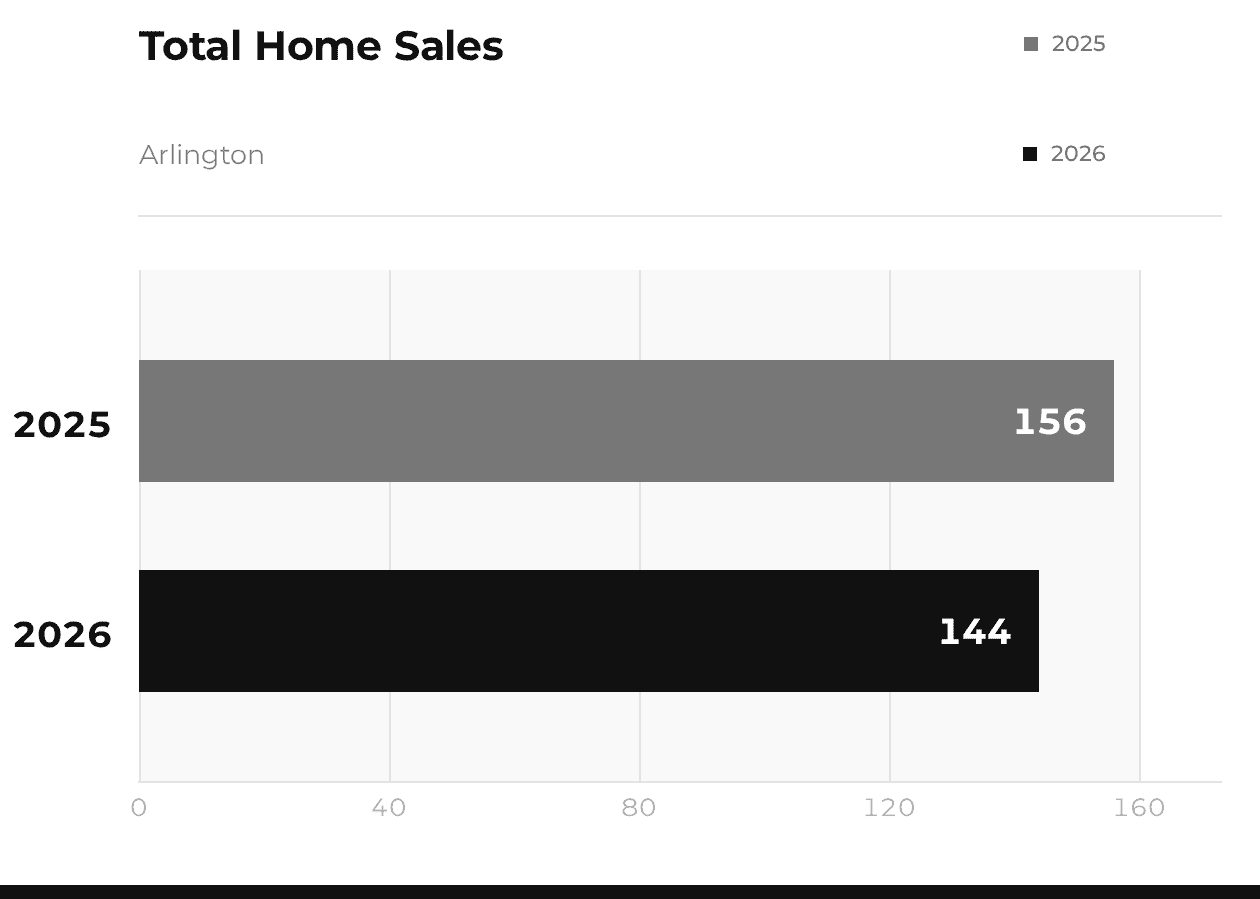
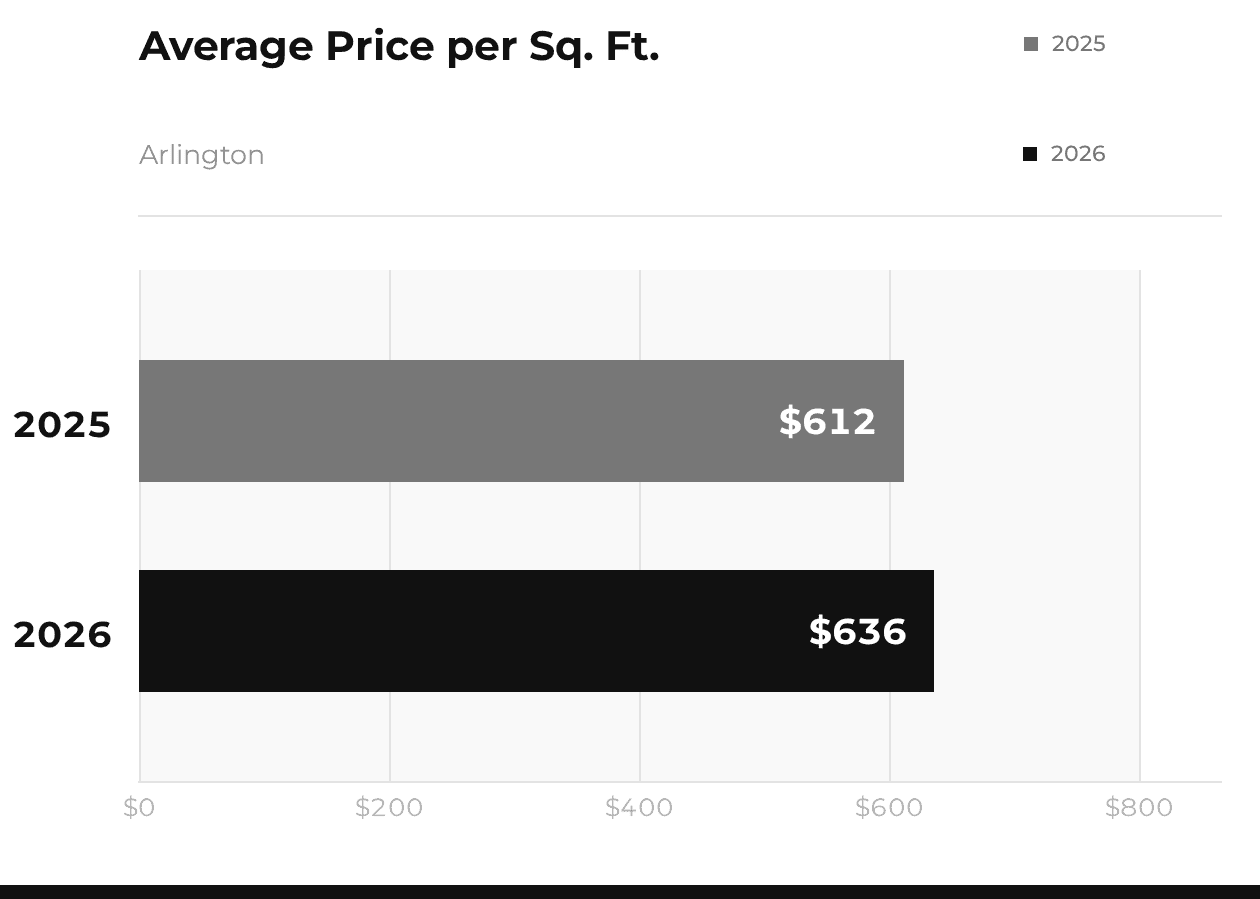
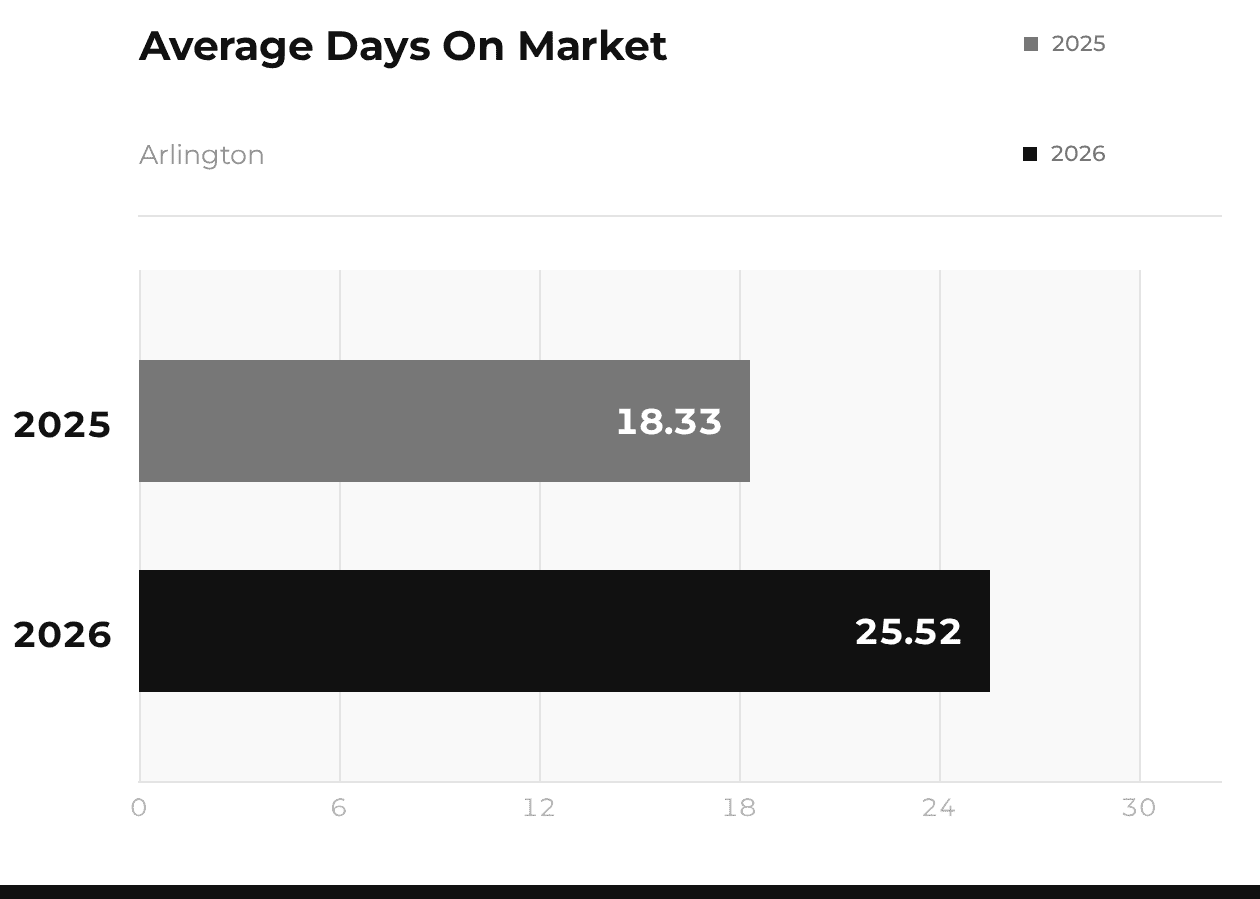
Arlington had the strongest price growth of the five. There were 144 sales year-to-date against 156 last year, and the average sale price rose to $1,444,300 from $1,330,248. Price per square foot went up too, $612 to $636, so this is real appreciation and not just a few larger houses pulling the average around. Time on market went from 18 days to 26. That is still quick, but it is a noticeable shift from a year ago.
Lexington
Lexington is still the busiest of the five, with 214 homes sold against 210 a year ago. The average sale price came in at $1,954,594, down from $2,123,133, but price per square foot barely moved, $585 against $591. That combination usually points to a different mix of houses selling rather than any softening in demand. Days on market reads 50 against 35. As we noted in August, that figure is being pushed up by a group of homes that sat unsold for a long stretch before finally closing. Those are working their way through, and the ones closing recently have taken noticeably less time. Well-priced homes in Lexington are still moving at close to last year’s pace.
Medford
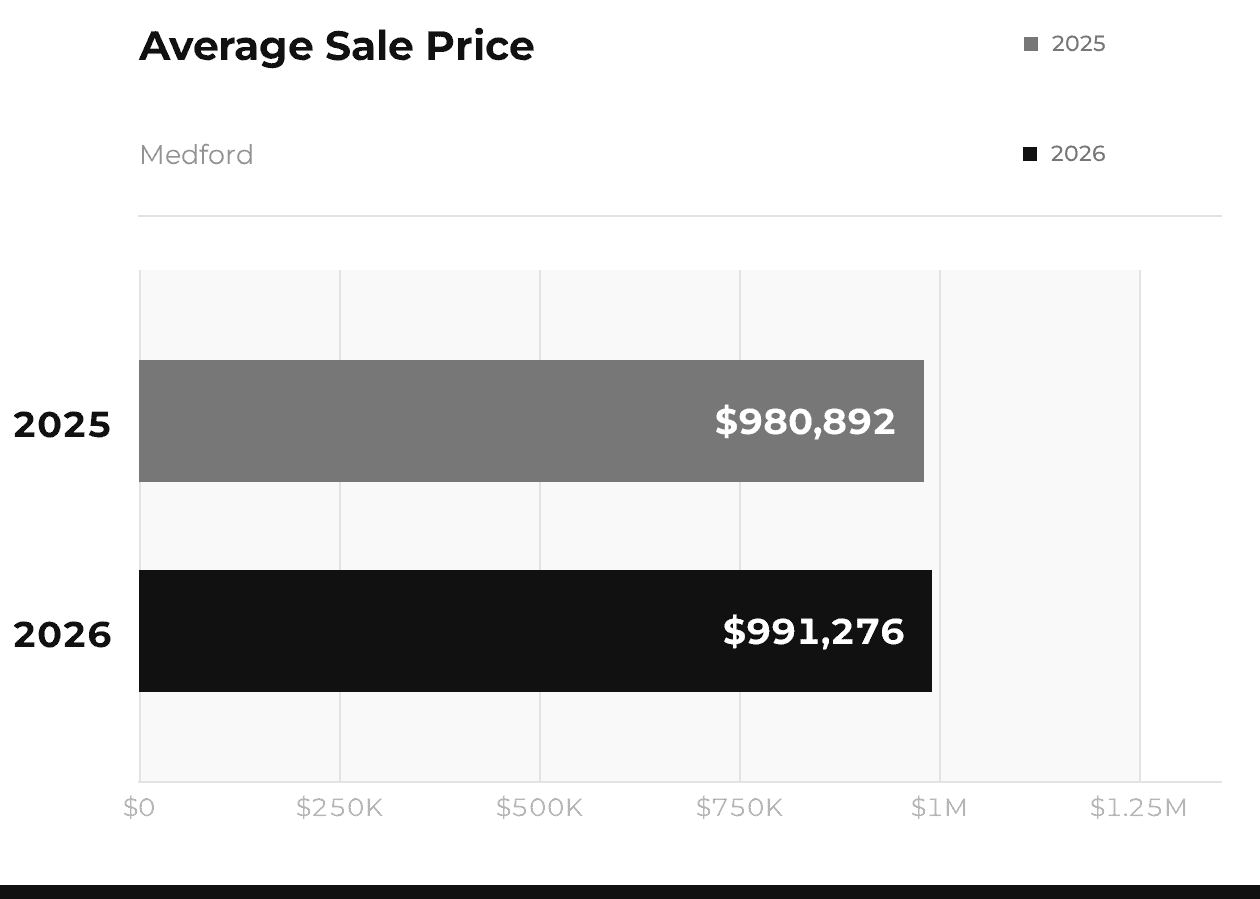
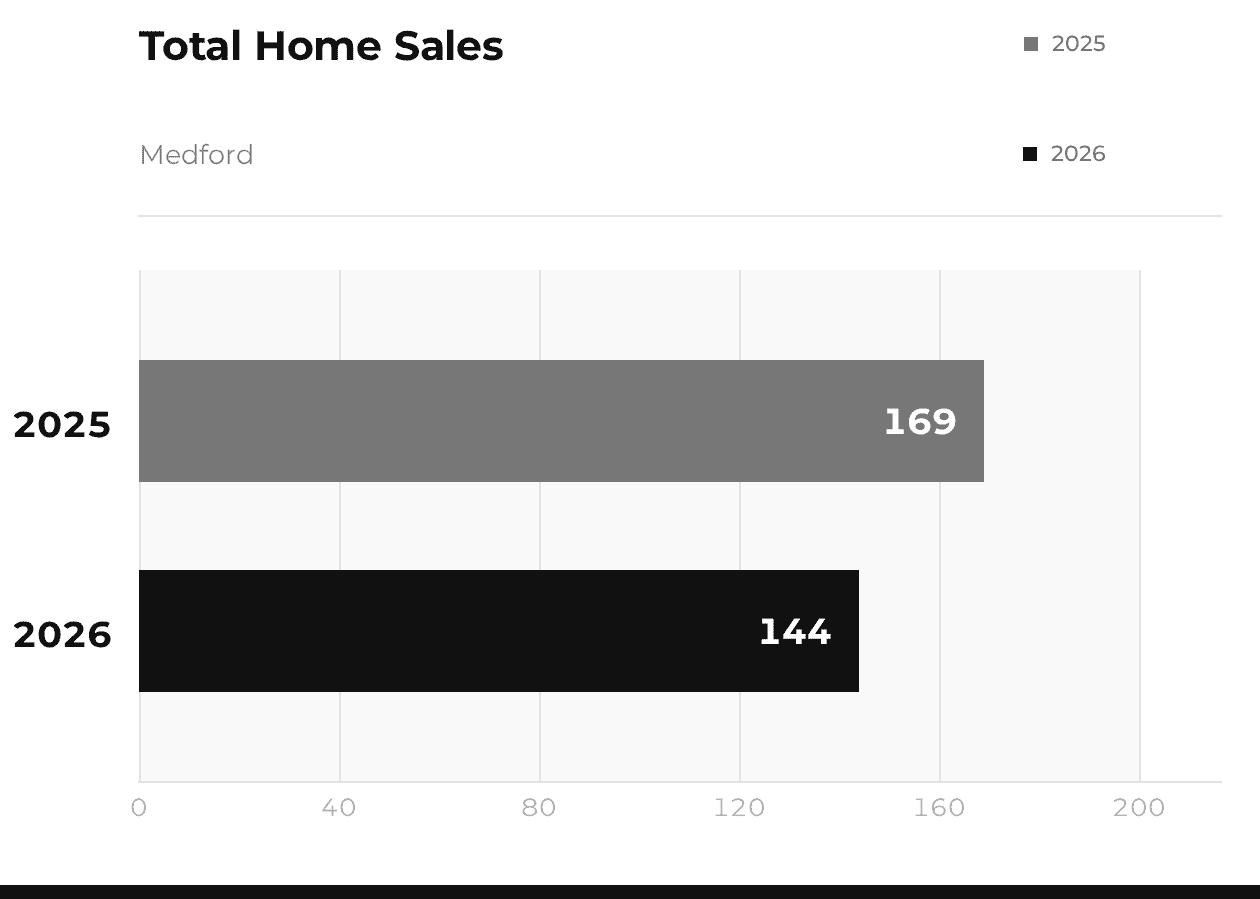
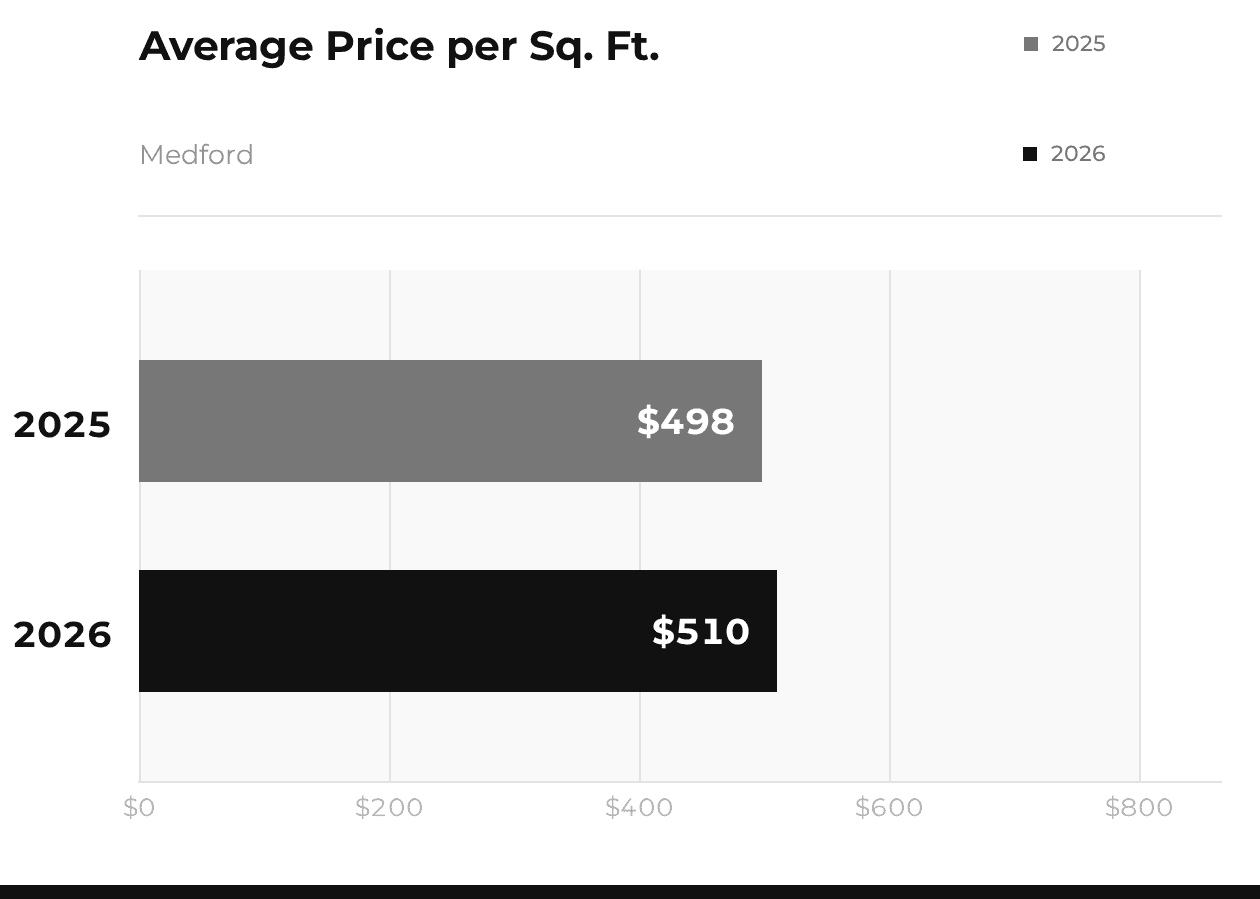
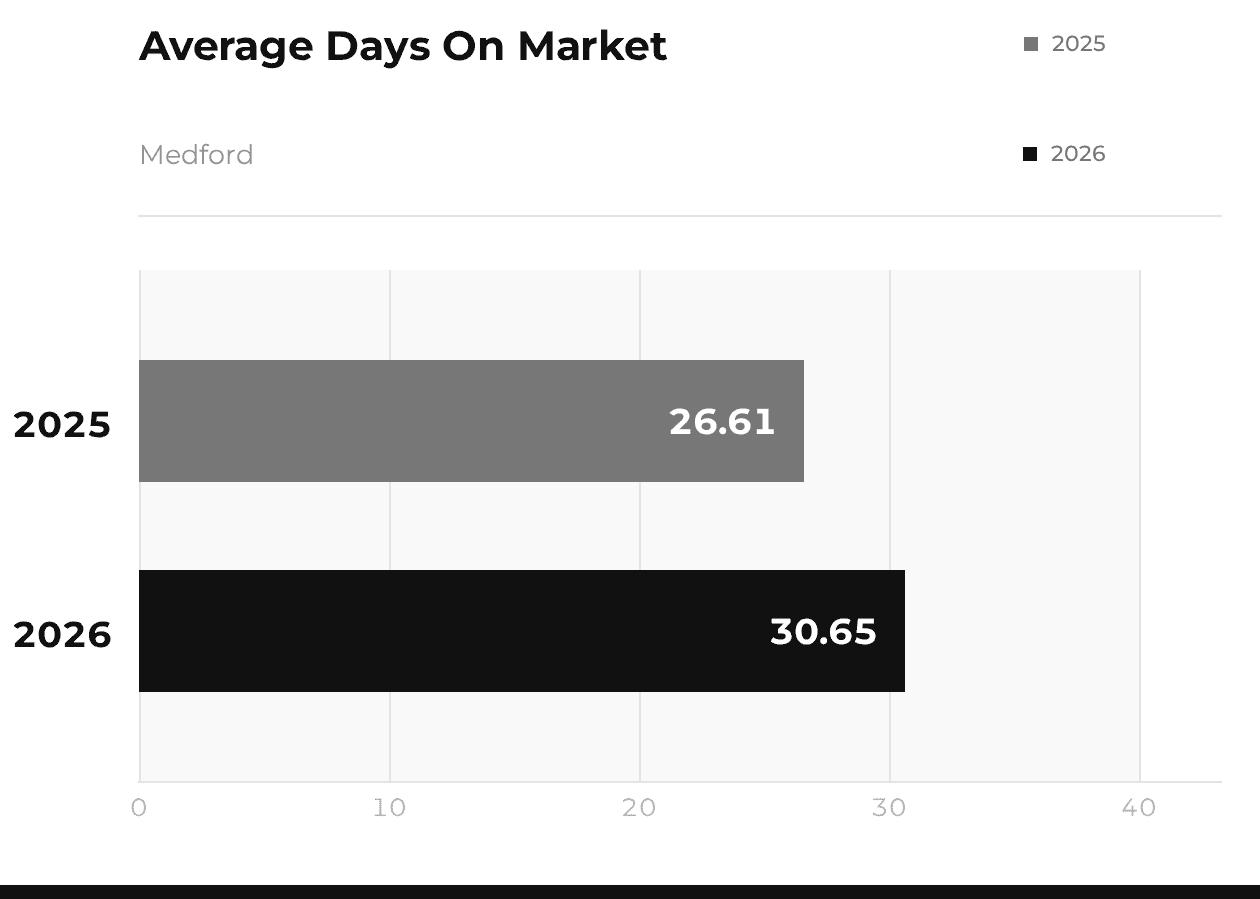
Medford is new to the report this month. It is one of the more affordable markets we cover, with an average sale price of $991,276 year-to-date, almost flat against $980,892 last year, and price per square foot at $510 against $498. Volume is where it gets interesting. There were 144 sales against 169 a year ago, the steepest drop of any town here. Homes are averaging 31 days on market, up from 27.
Reading
Reading also joins us this month, and it is the most affordable market we track at $482 per square foot. Compare that with Arlington at $636 or Winchester at $569. It also had the best sales growth of the five, 140 homes year-to-date against 124 in 2025. The average sale price is $1,079,915, up from $1,030,604. At 23 days on market against 20 last year, Reading is the fastest-moving town in the group right now.
Winchester
Winchester was the steadiest of the five. Sales rose to 128 from 123, and the average sale price eased to $1,900,641 from $1,966,241. Price per square foot was essentially unchanged at $569 against $574, and days on market went from 32 to 36. More homes selling at a stable per-foot value, with little change in how long they take.
What does this mean for your home?
These are town-wide averages, and your house is not an average. Whether Reading’s faster pace or Arlington’s per-foot gain actually applies to your home depends on the street it sits on, the shape it is in, and what else buyers are looking at right now. If you are thinking about a move this fall, give us a call and we will walk through what these numbers mean for your place specifically.