

April 30, 2026 | Market Reports
Real Estate Market Update | April 2026

April in the North of Boston market came with a few surprises. Winchester saw a meaningful jump in sales volume. Arlington posted some of the strongest price gains of the spring. Lexington held its premium position while moving at a quieter pace. Here is a town-by-town look at how April 2026 compared to April 2025.
Winchester
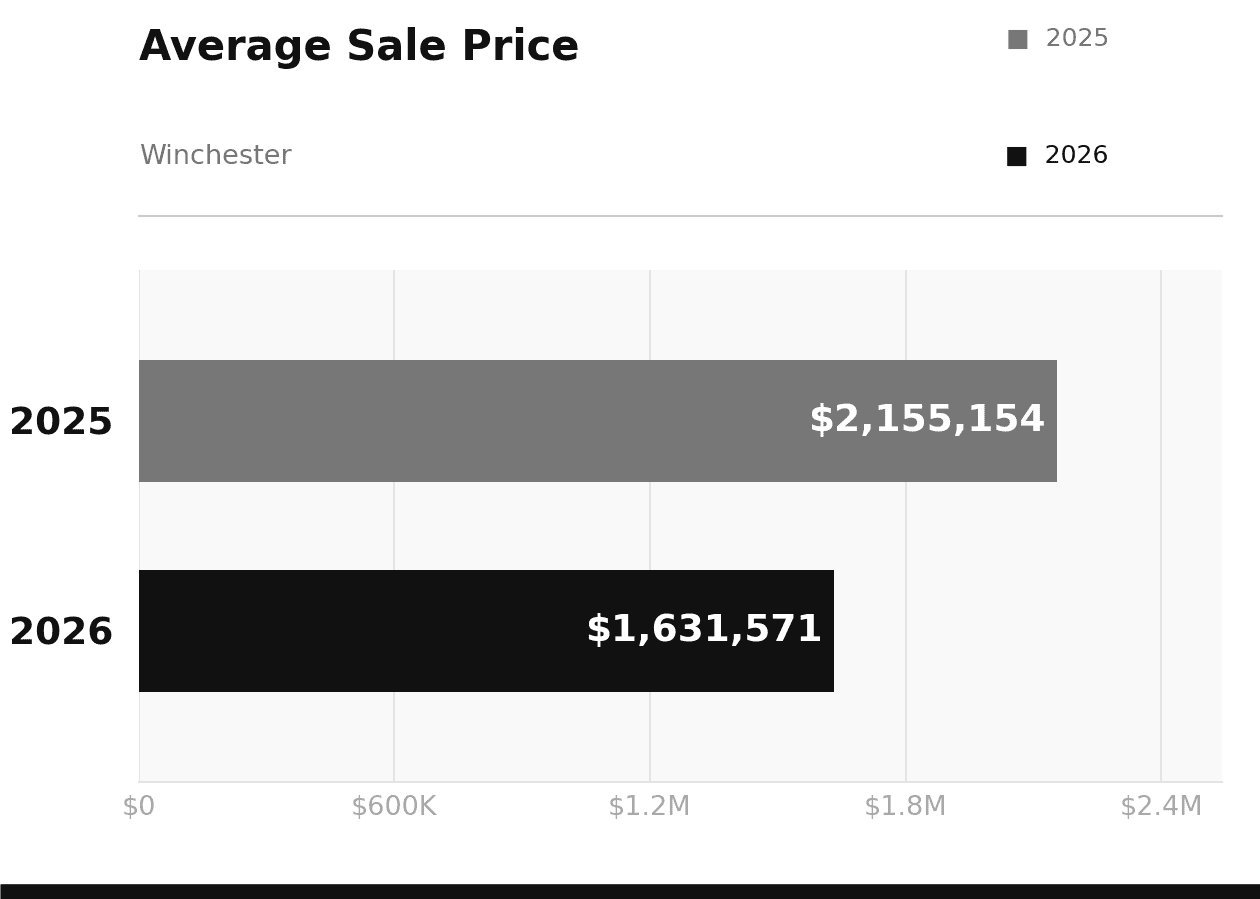
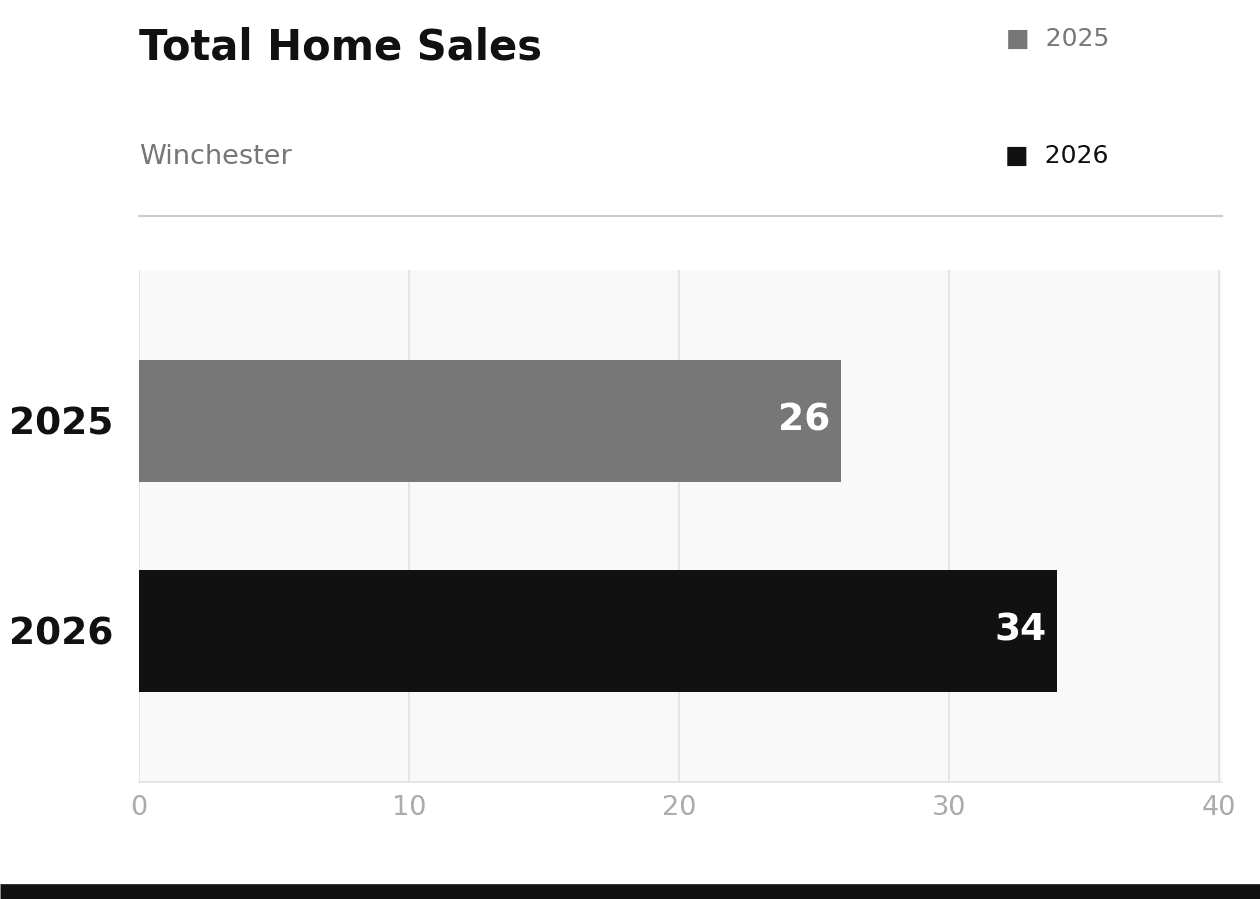
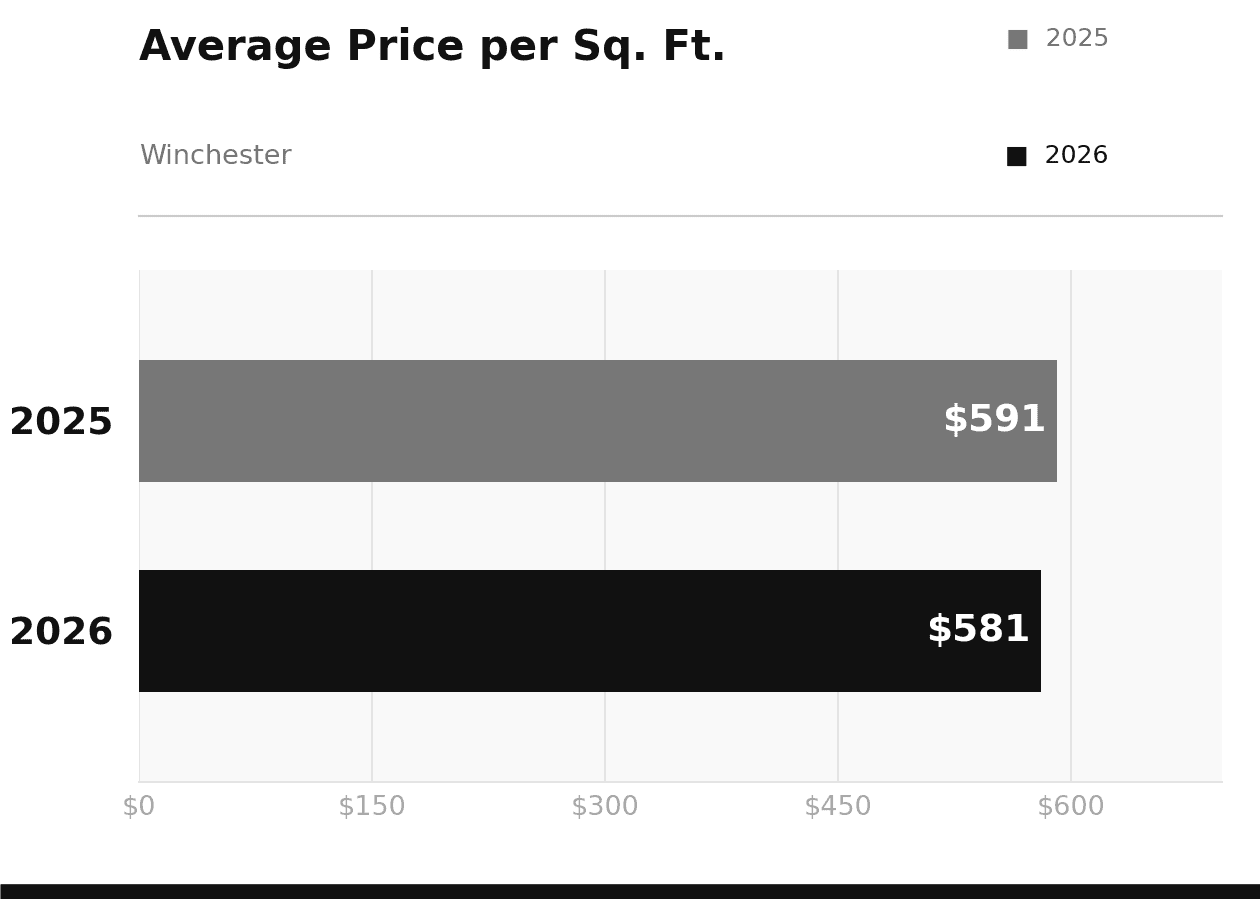
Winchester had a busy April. Sales volume climbed 31% year-over-year, with 34 homes closing compared to 26 in April 2025. The average sale price came in lower at $1,631,571 versus $2,155,154 a year ago, but that gap is largely explained by the mix of what sold. Price per square foot, a more reliable measure of underlying value, fell by just $10 from $591 to $581, signaling that the market itself held relatively steady even as fewer luxury properties transacted this particular month.
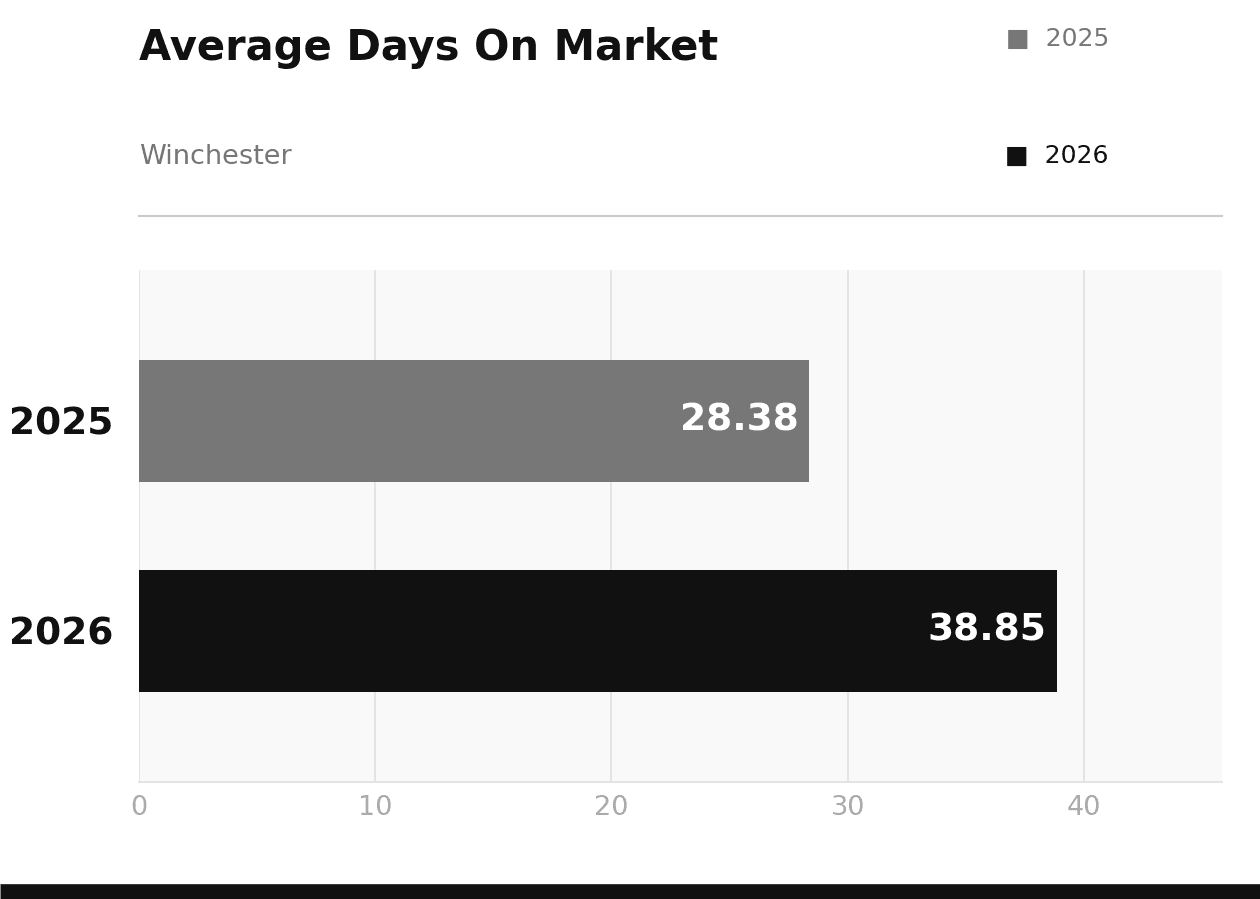
Days on market did stretch out, rising from about 28 days last April to nearly 39 this year. Homes are still moving, but buyers are being a bit more deliberate before committing. For sellers, that means pricing cleanly from day one matters more than it did a year ago.
Lexington
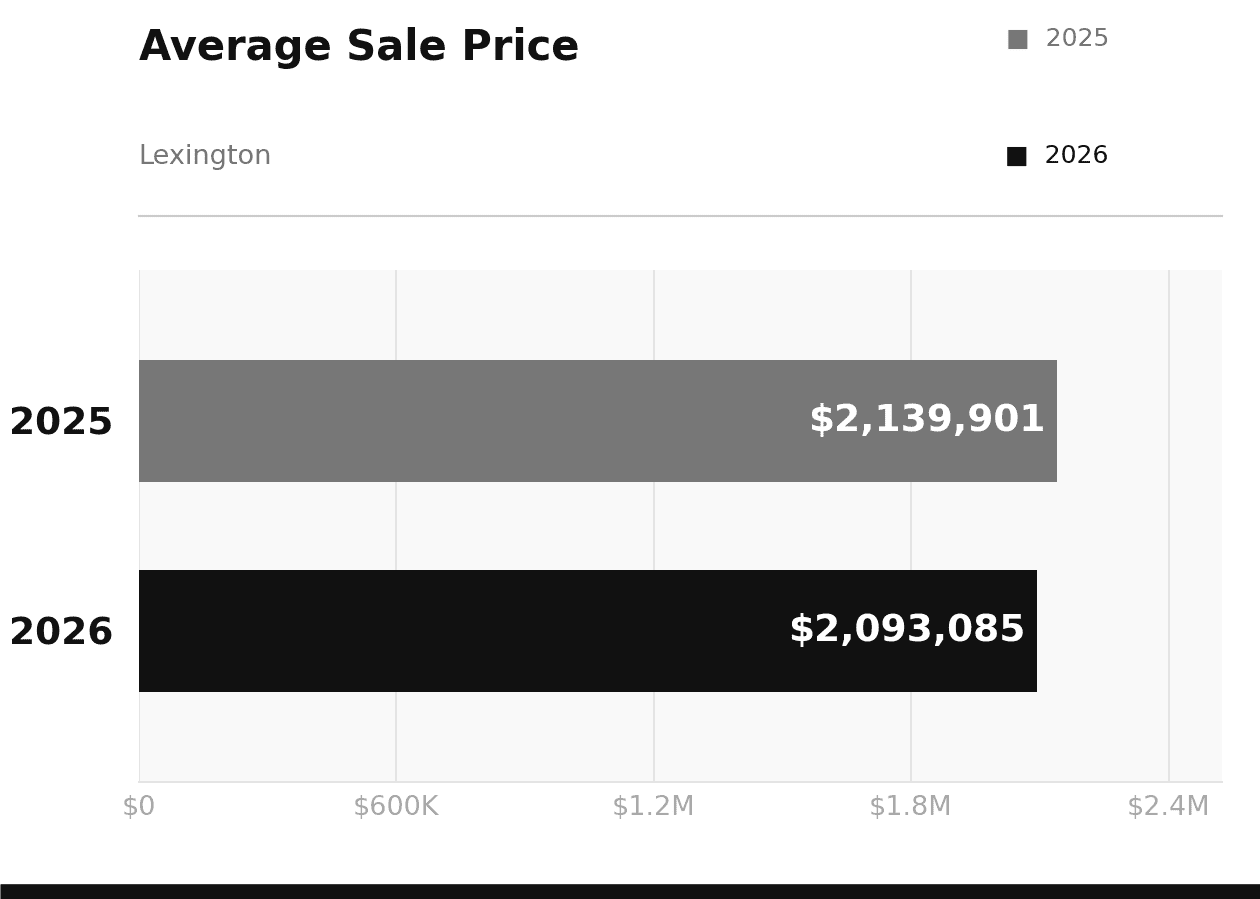
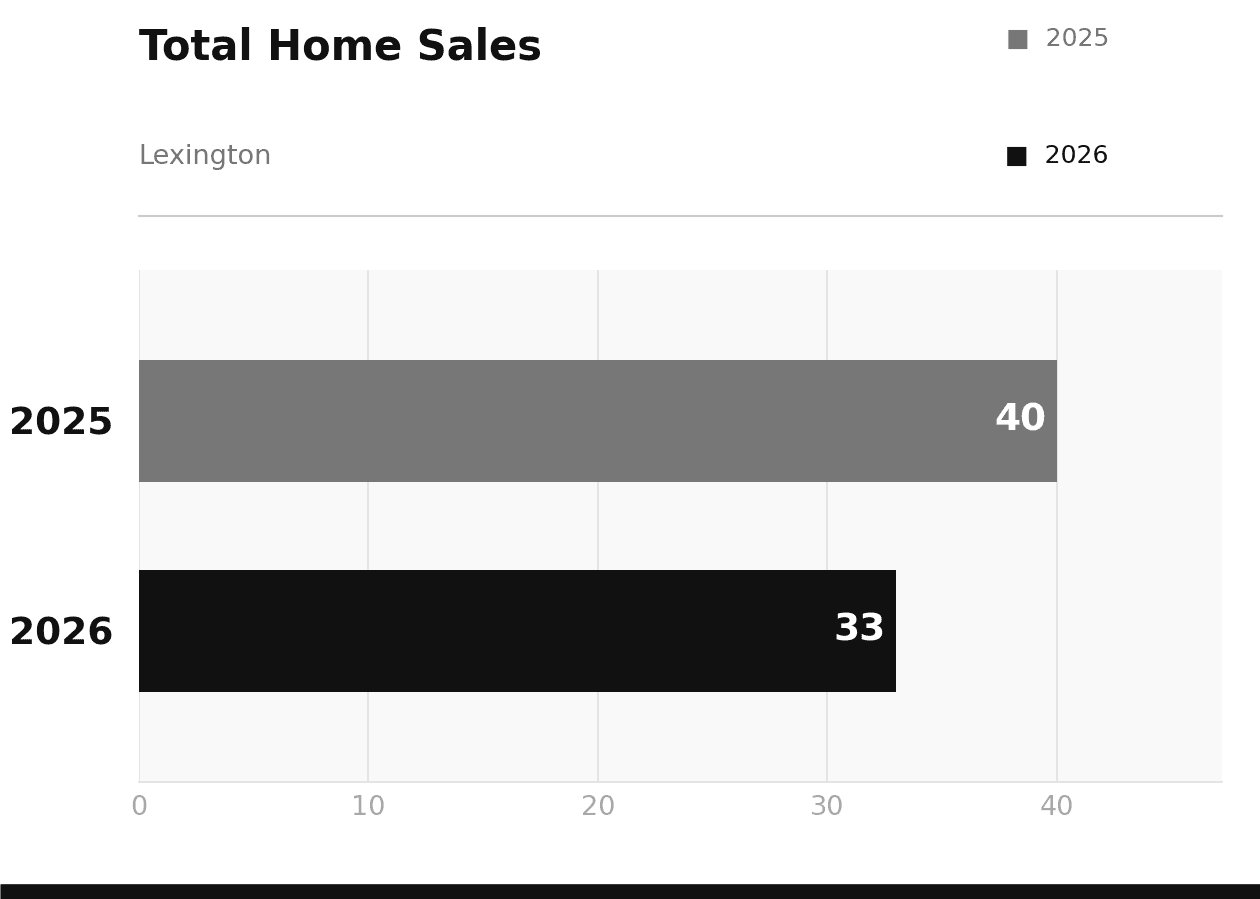
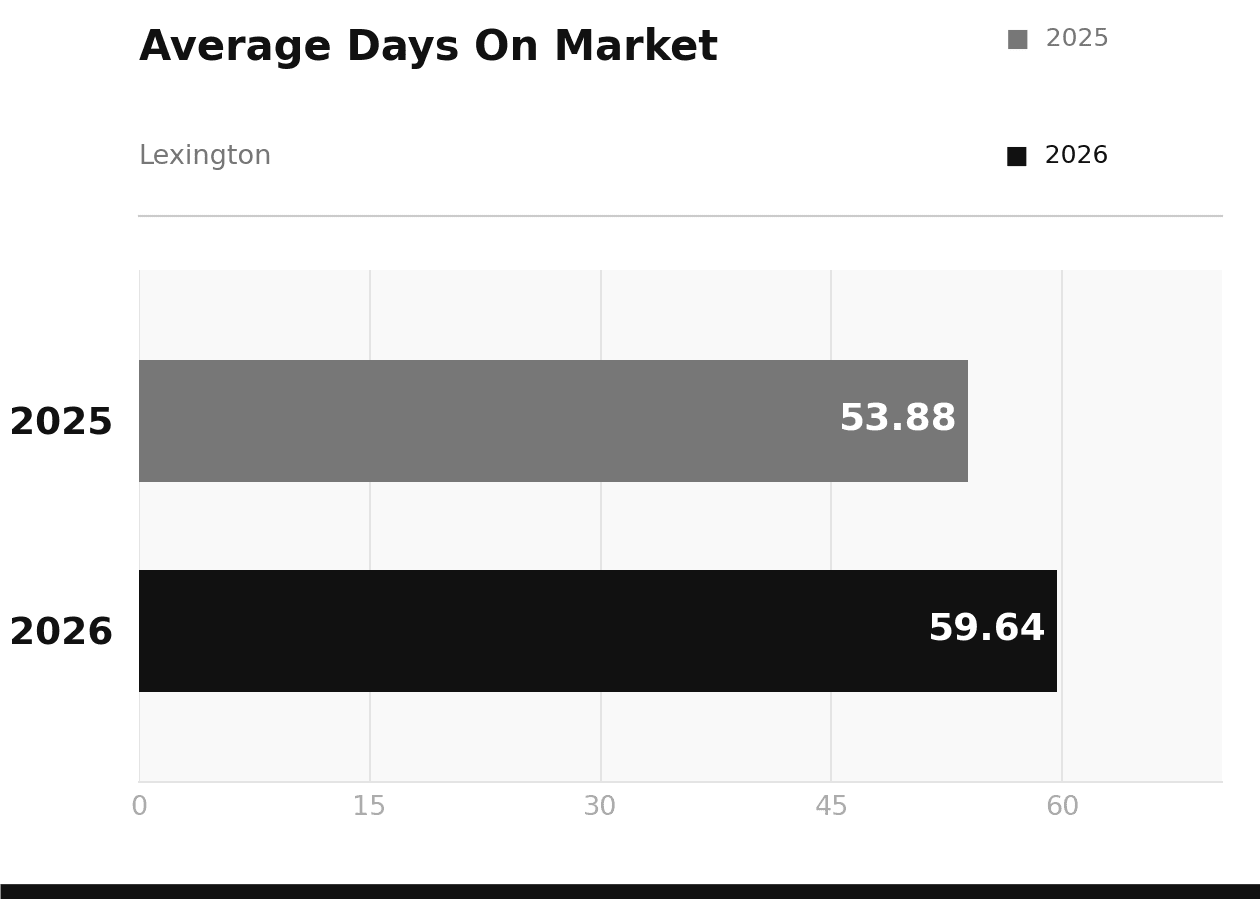
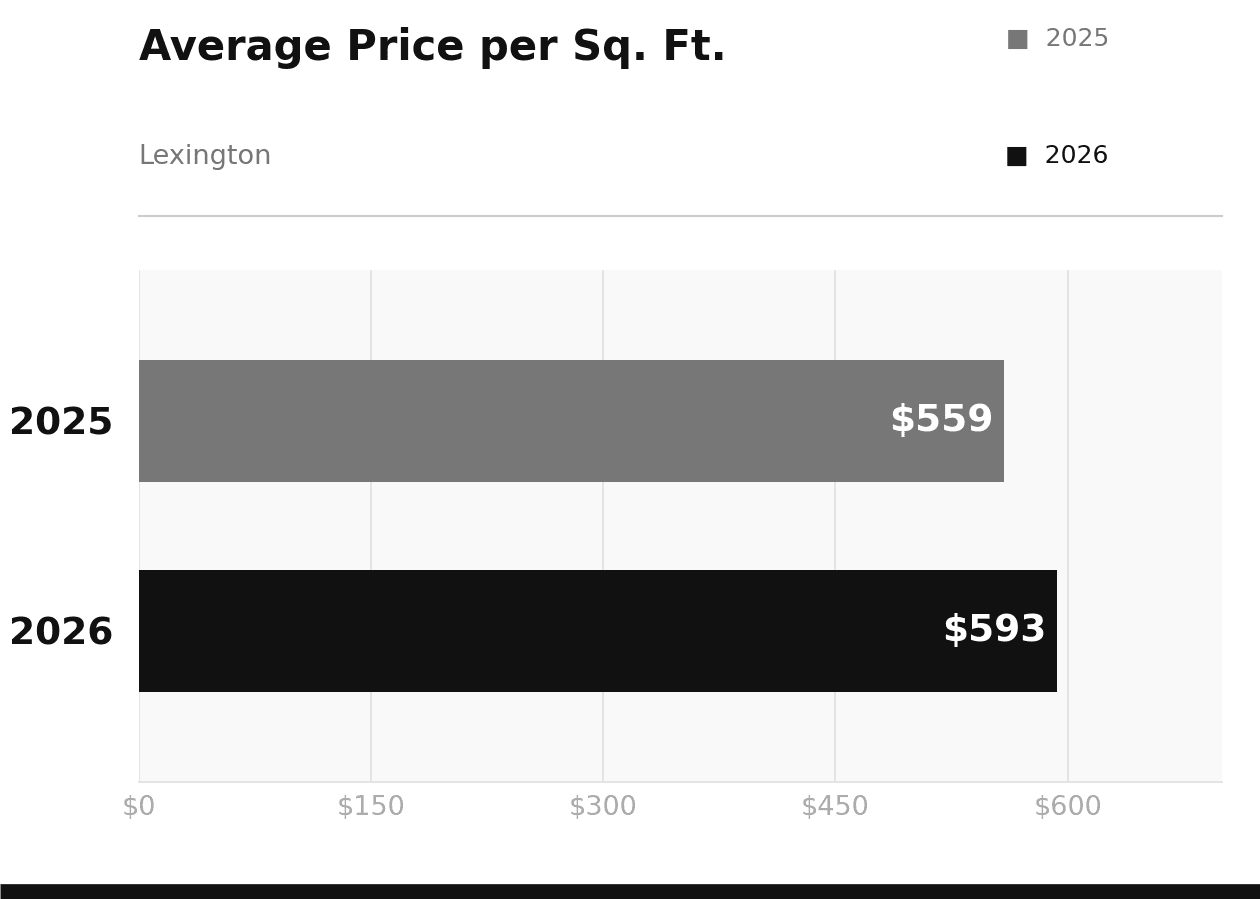
Lexington stayed firmly in premium territory in April. Average sale prices held close to last year at $2,093,085, down only about 2% from $2,139,901 in April 2025. Transaction volume was lighter, with 33 homes closing versus 40 a year ago, and days on market crept up slightly from 54 to nearly 60. But price per square foot actually improved, rising 6% from $559 to $593. That tells you buyers are still willing to pay up for the right Lexington home even when the overall pace of the market slows a bit.
Lexington continues to attract buyers who prioritize school district strength and long-term value. When fewer homes trade hands, it is often a supply story more than a demand one. Sellers who list in the right condition and at a well-supported price are still finding qualified buyers.
Arlington
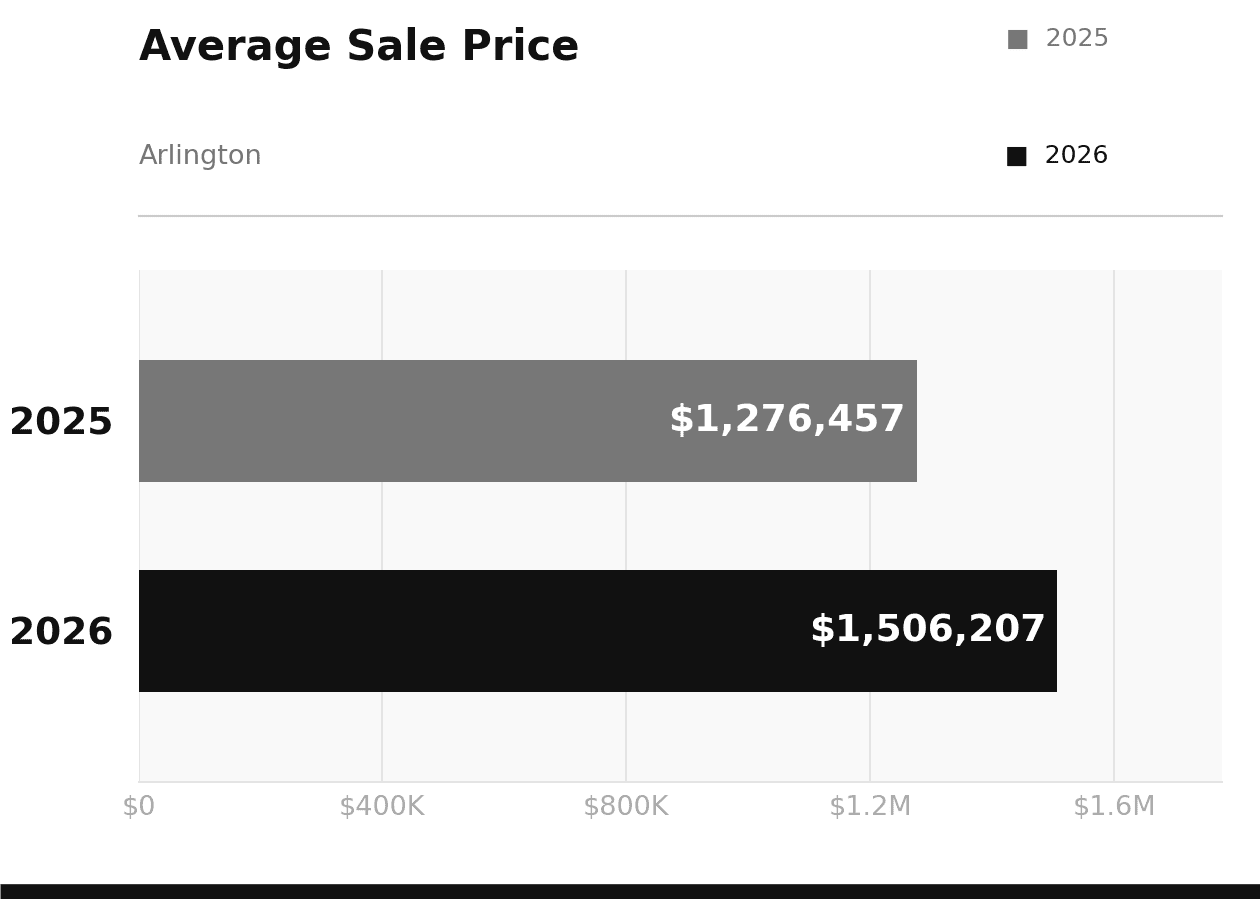
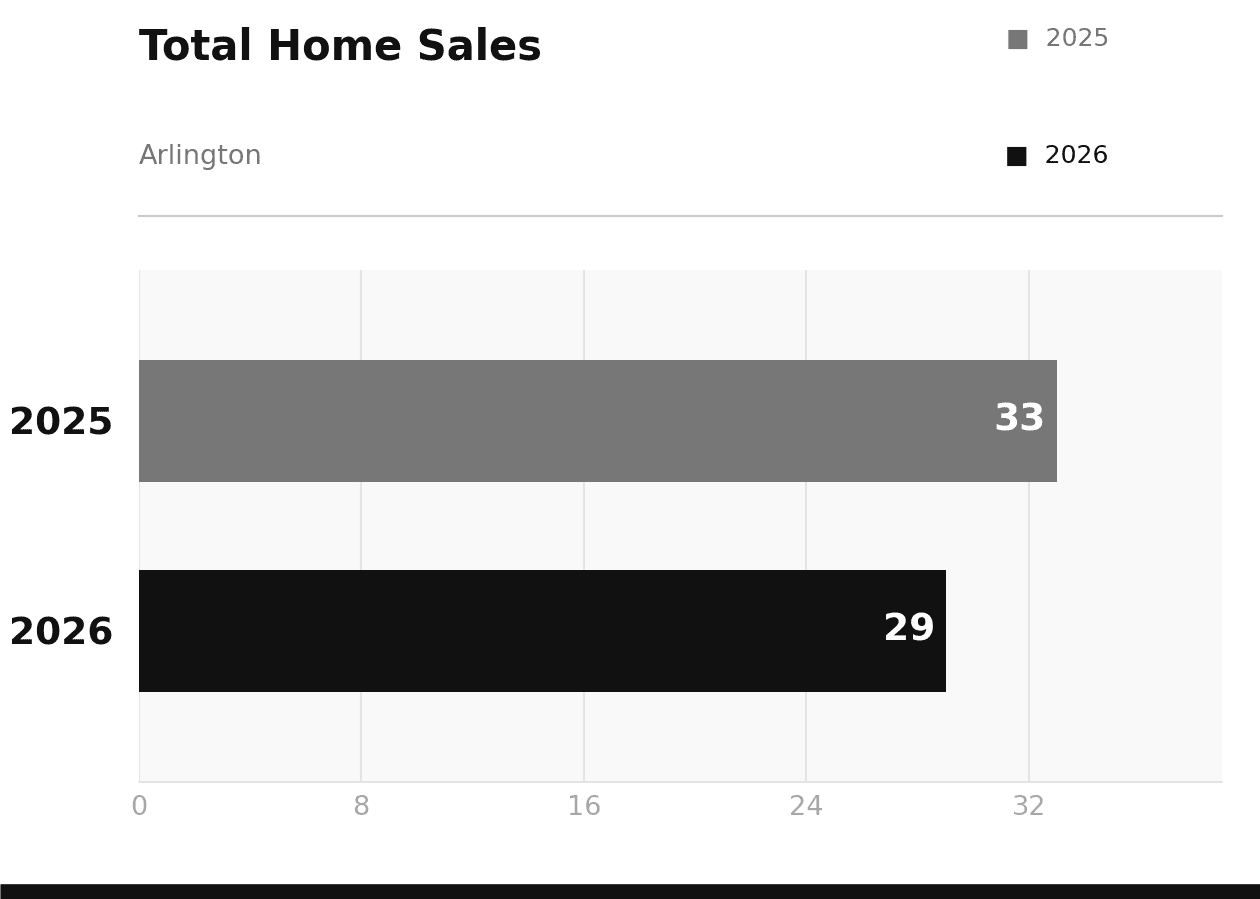
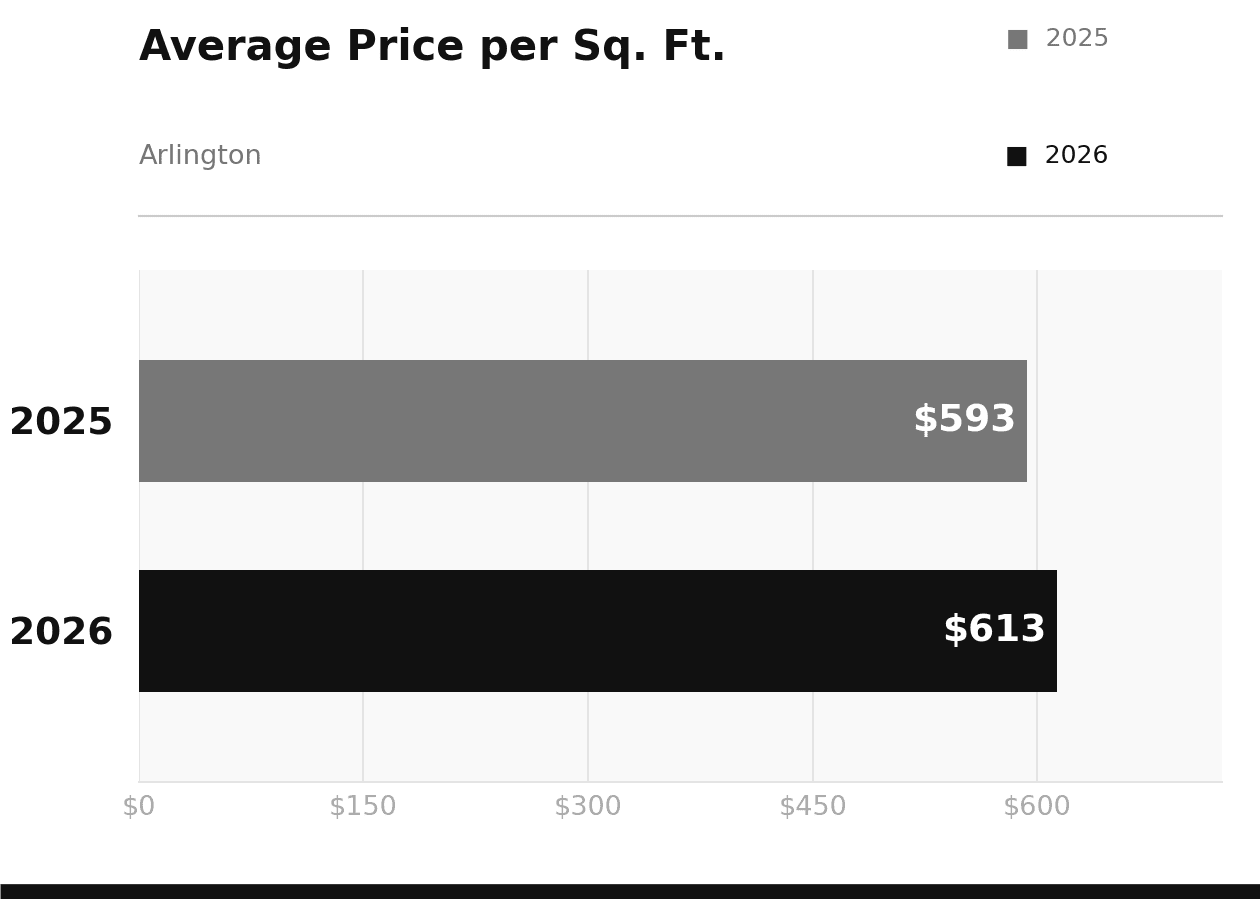
Arlington was the standout story of the spring. Average sale prices jumped 18% year-over-year, from $1,276,457 in April 2025 to $1,506,207 this April. Price per square foot also moved up, from $593 to $613. Fewer homes traded hands compared to last year, 29 versus 33, but the ones that did commanded noticeably stronger prices. That combination of lower volume and higher prices points to a market where demand is concentrated and buyers are competing harder for the homes that do come available.
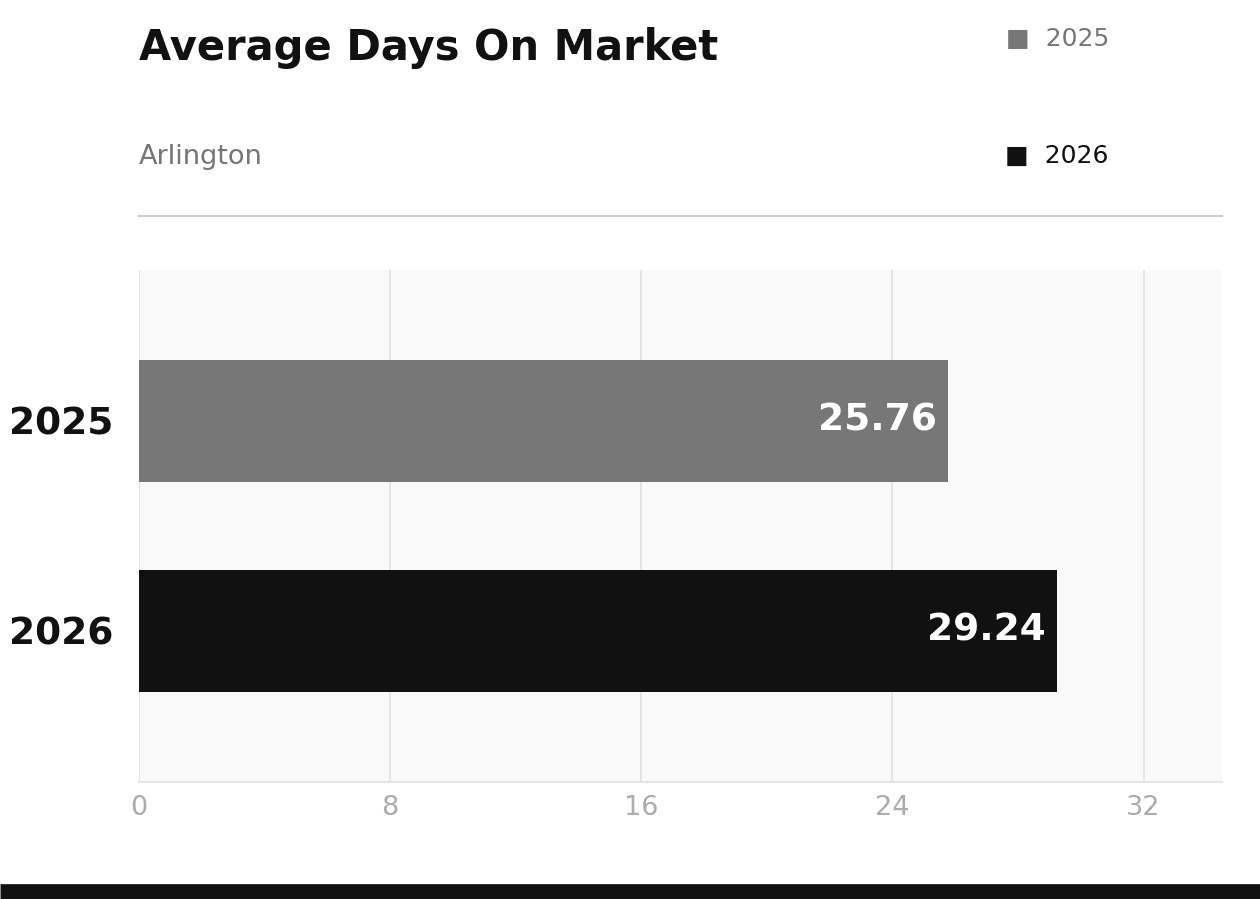
Days on market stayed low by North of Boston standards, averaging just under 30 days. Arlington continues to attract buyers who want proximity to Boston without paying Lexington or Winchester prices, and that demand is clearly showing up in the numbers. If you own in Arlington and have been thinking about selling, the current environment is working in your favor.
What does this mean for your home?
Whether you are thinking about selling this spring or keeping an eye on the market, Sven and the team are happy to walk you through what these numbers mean for your specific situation.