

March 31, 2026 | Market Reports
Real Estate Market Update | March 2026

March brought the first real sign of spring activity across the North of Boston market, with Winchester leading the way in volume and Arlington posting a price jump that turned some heads. Lexington saw lighter transaction numbers but strong per-foot pricing that continued a trend from earlier in the year. Here is a town-by-town look at March 2026 compared to March 2025.
Winchester
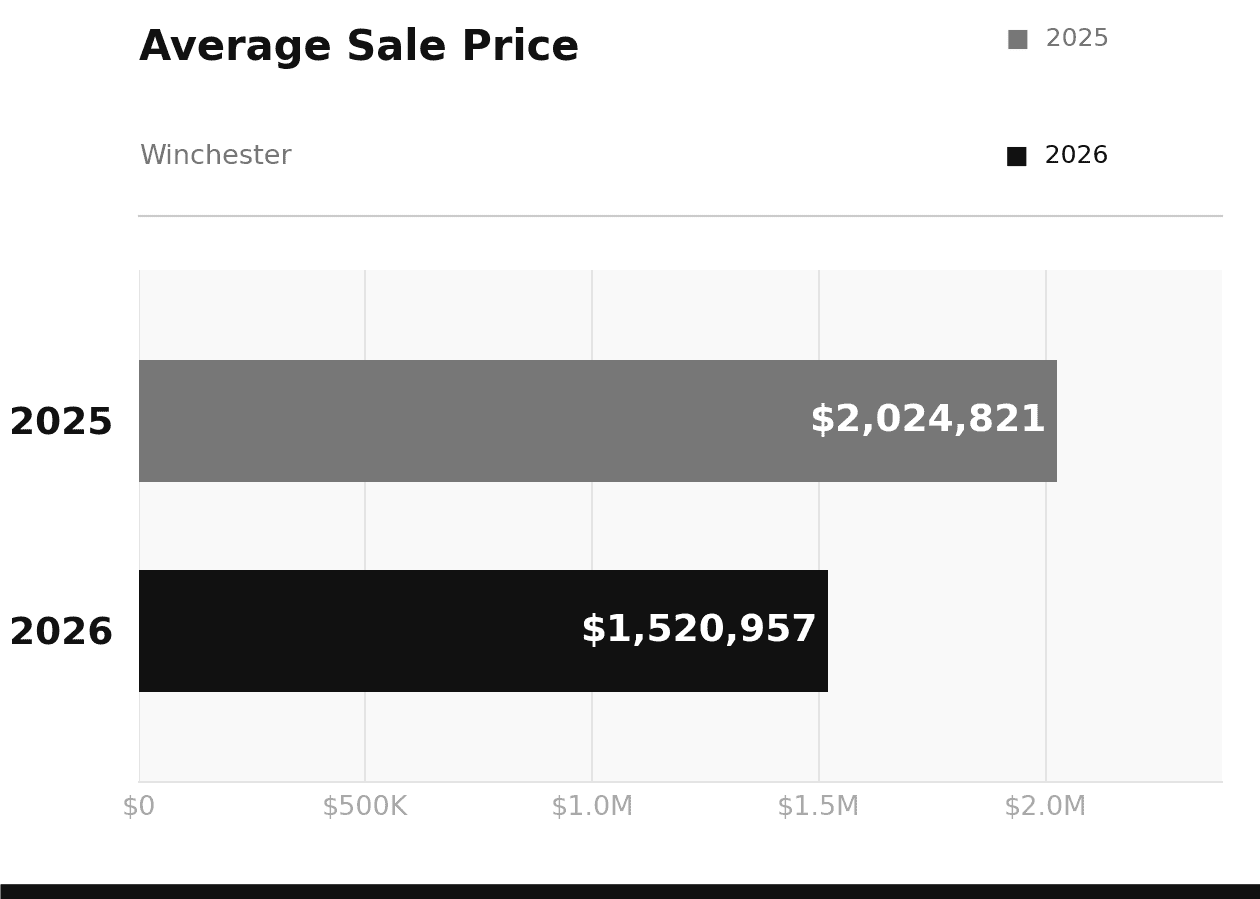
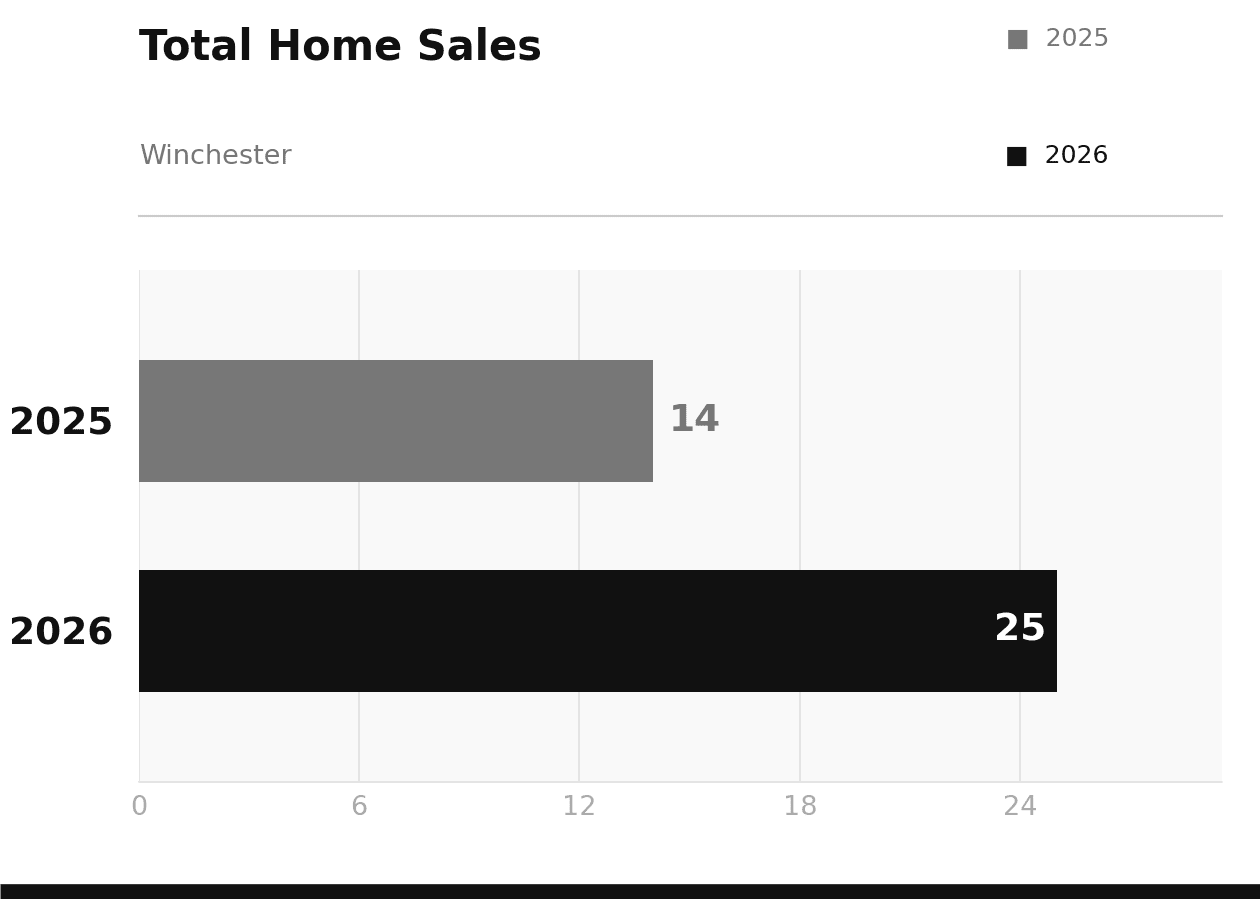
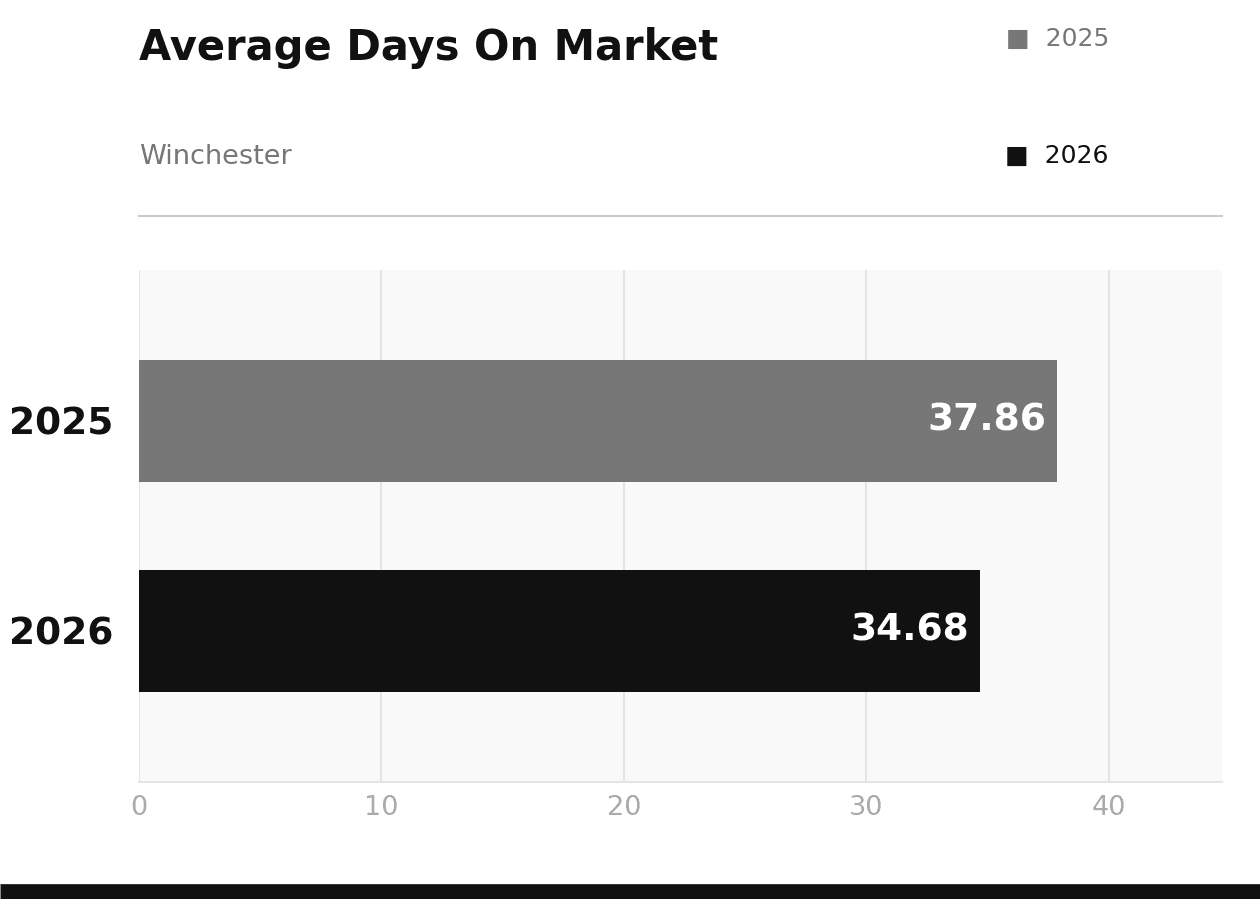
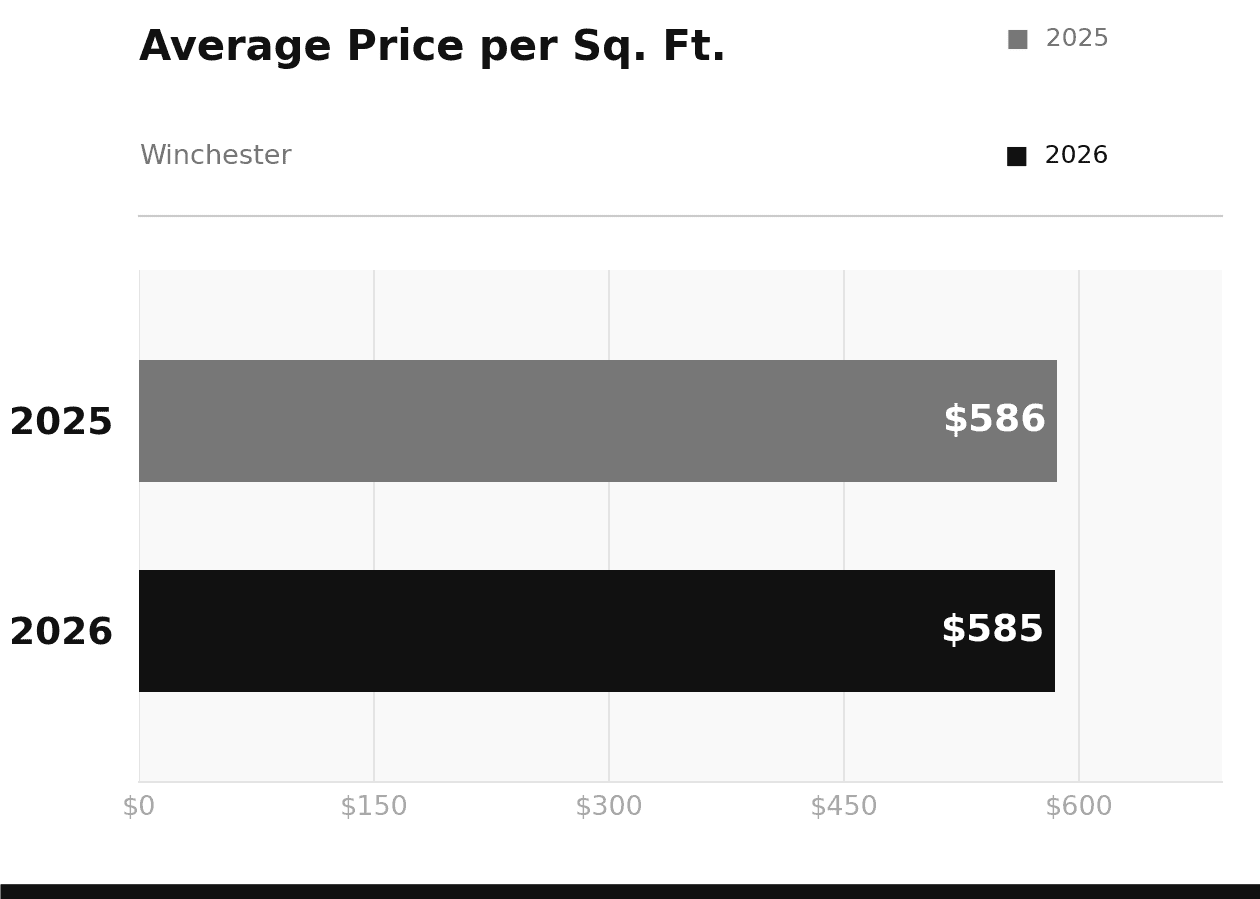
Winchester had a strong March in terms of volume, with 25 homes closing compared to 14 in March 2025, a 79% increase. Average sale price came in at $1,520,957 versus $2,024,821 the prior year, but price per square foot tells a more grounded story: it barely moved, falling just $1 from $586 to $585. The gap in average prices is almost entirely explained by the mix of homes that transacted, with fewer luxury-tier properties closing this March. Days on market also improved slightly, from about 38 days to just under 35, meaning well-prepared homes were finding buyers a bit faster than last spring.
For Winchester sellers, the takeaway is that buyer activity picked up meaningfully in March and homes priced realistically from the start moved well. The per-square-foot stability is the number to watch.
Lexington
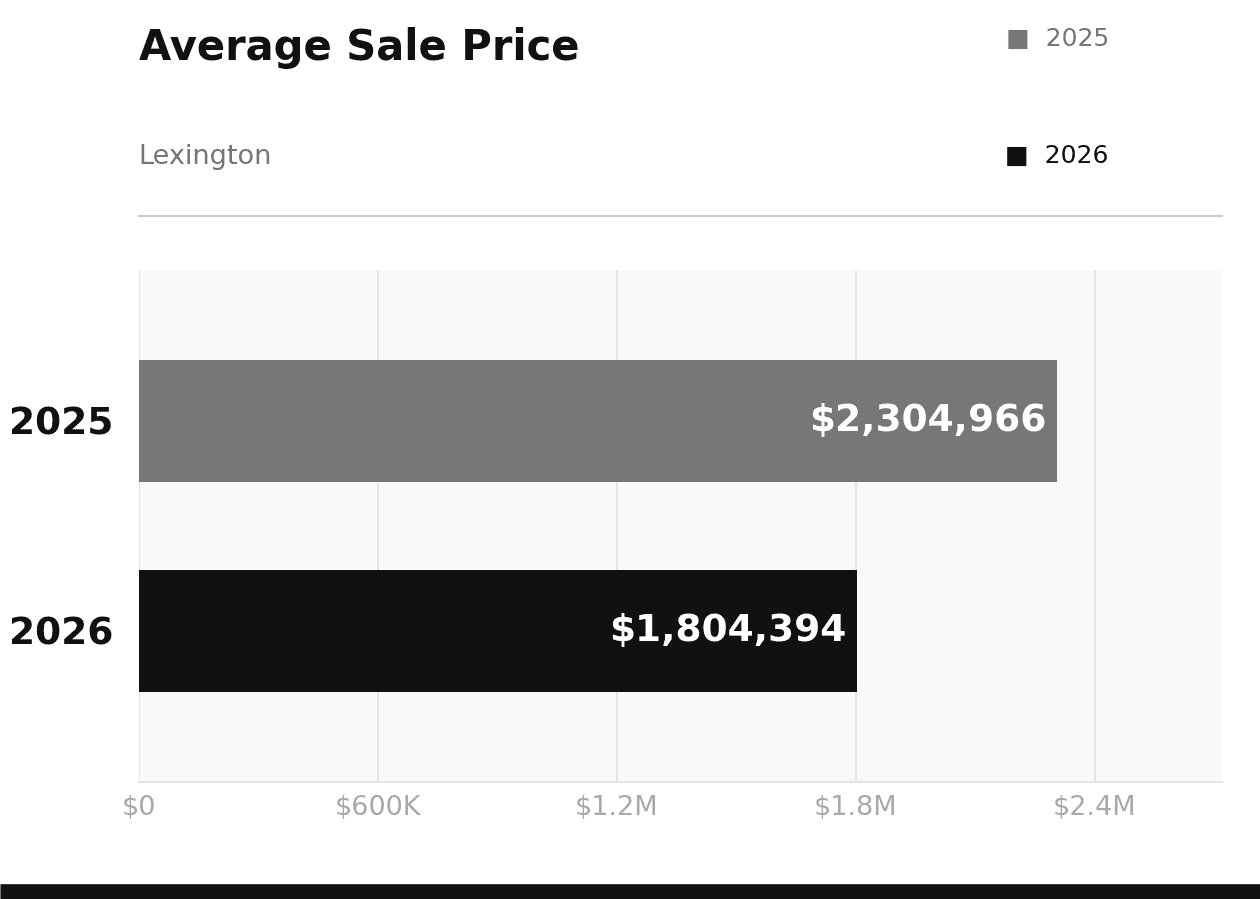
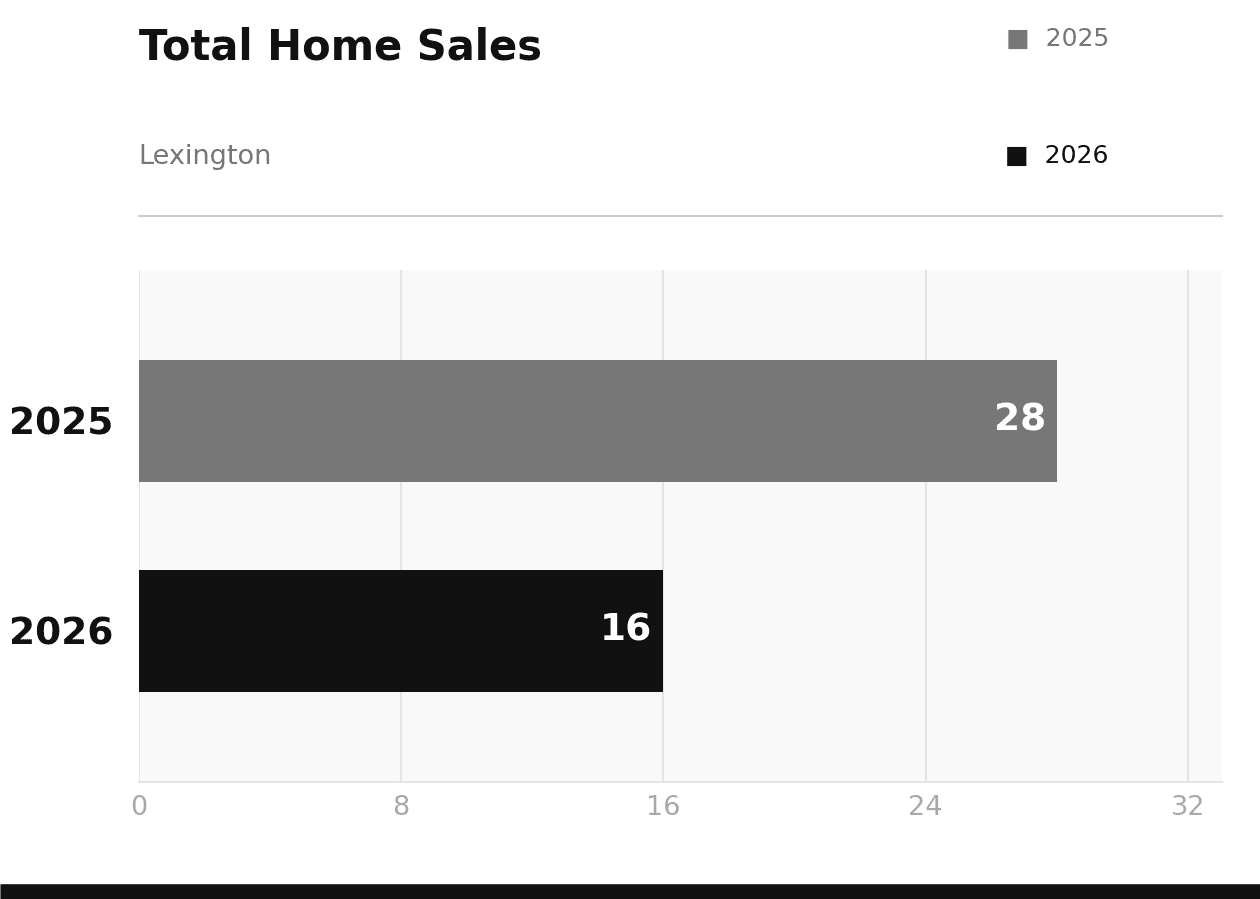
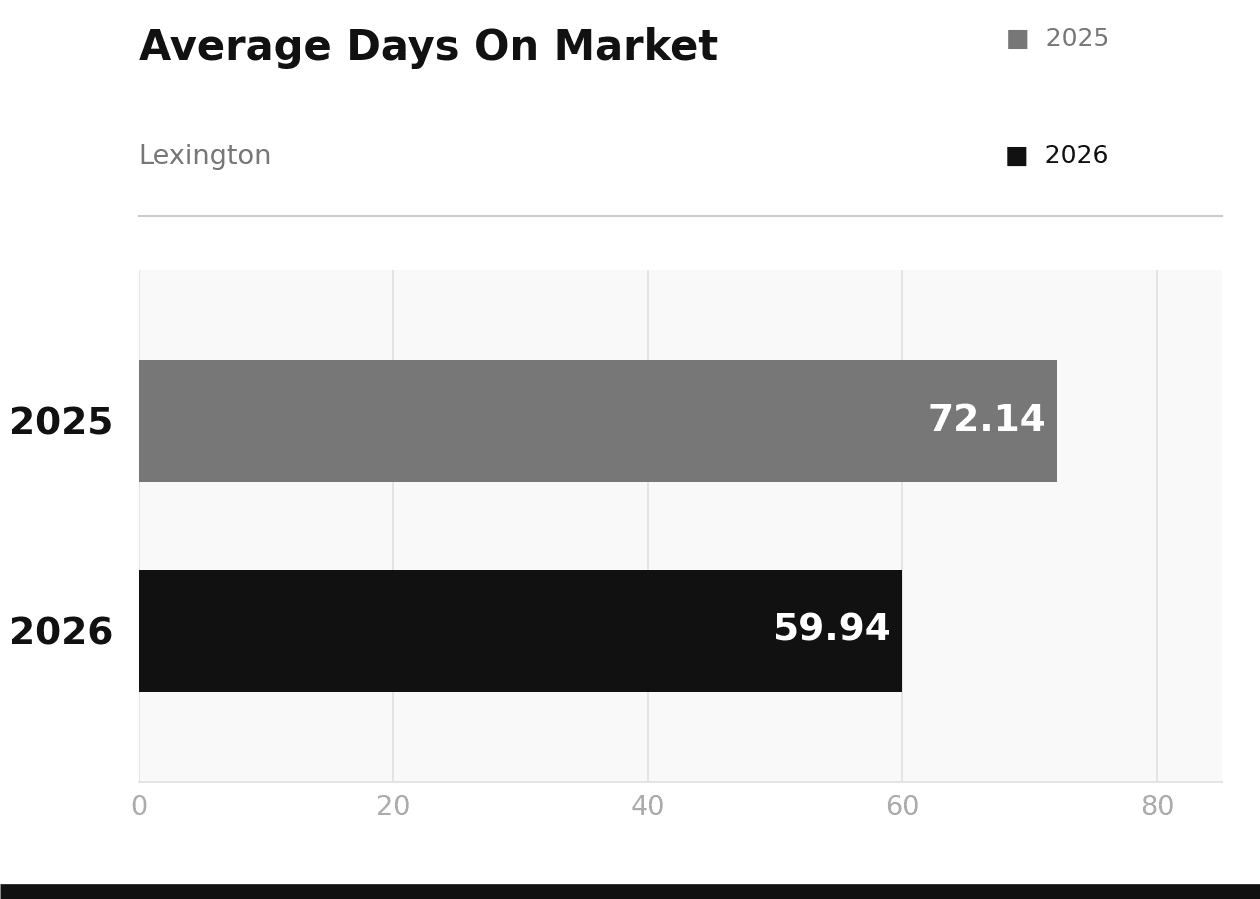
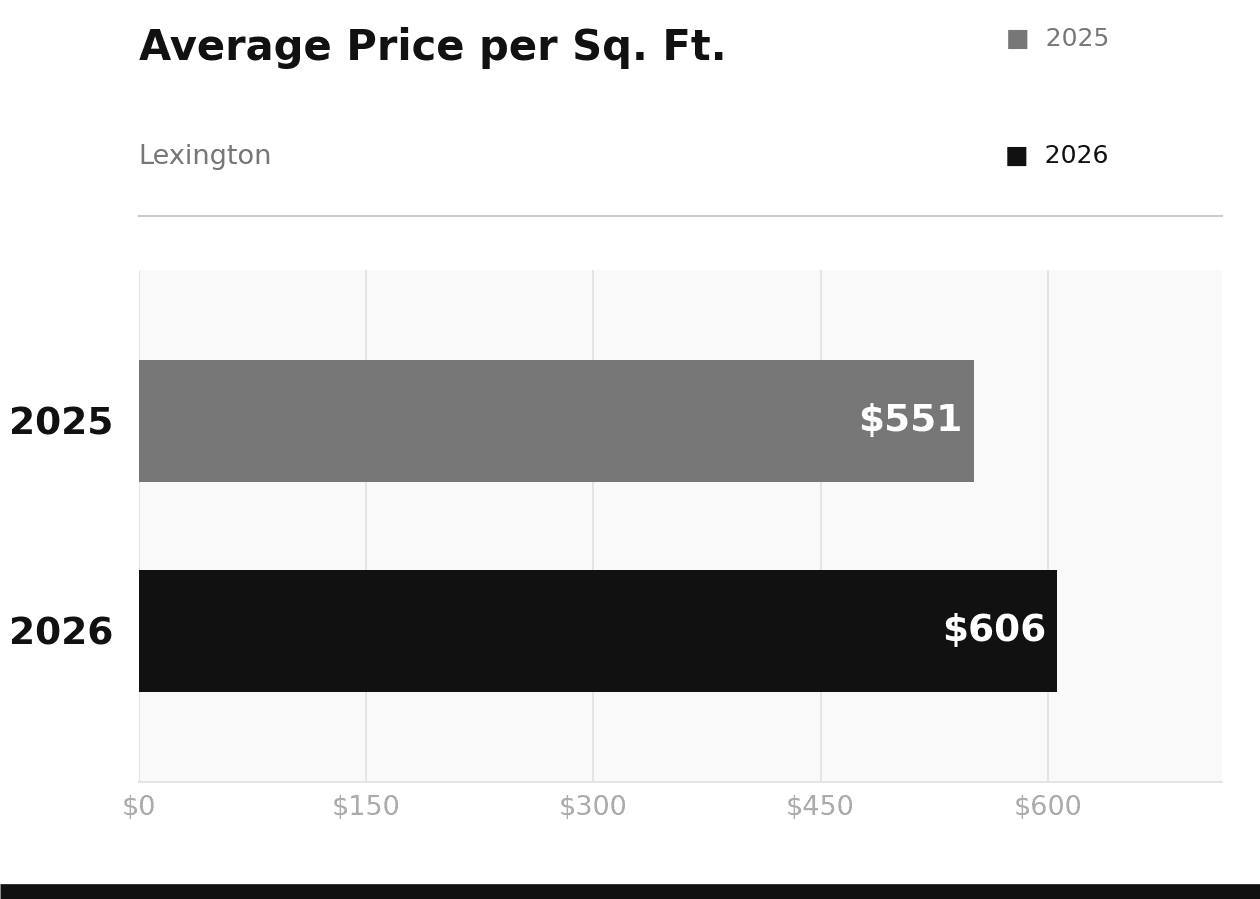
Lexington saw fewer closings in March, with 16 homes trading hands compared to 28 in March 2025. Average sale price came in at $1,804,394 against $2,304,966 a year ago. That is a significant-looking gap, but price per square foot moved in the opposite direction, climbing 10% from $551 to $606. The interpretation is the same as it has been throughout early 2026: a different mix of homes closed, with fewer of the higher-end transactions that were present in March 2025. Days on market also improved, dropping from about 72 days to 60, a meaningful improvement that suggests buyers are acting more decisively on homes they like.
Lexington remains a market where the right home at the right price finds a buyer. The per-foot appreciation and the shorter time to contract both support that.
Arlington
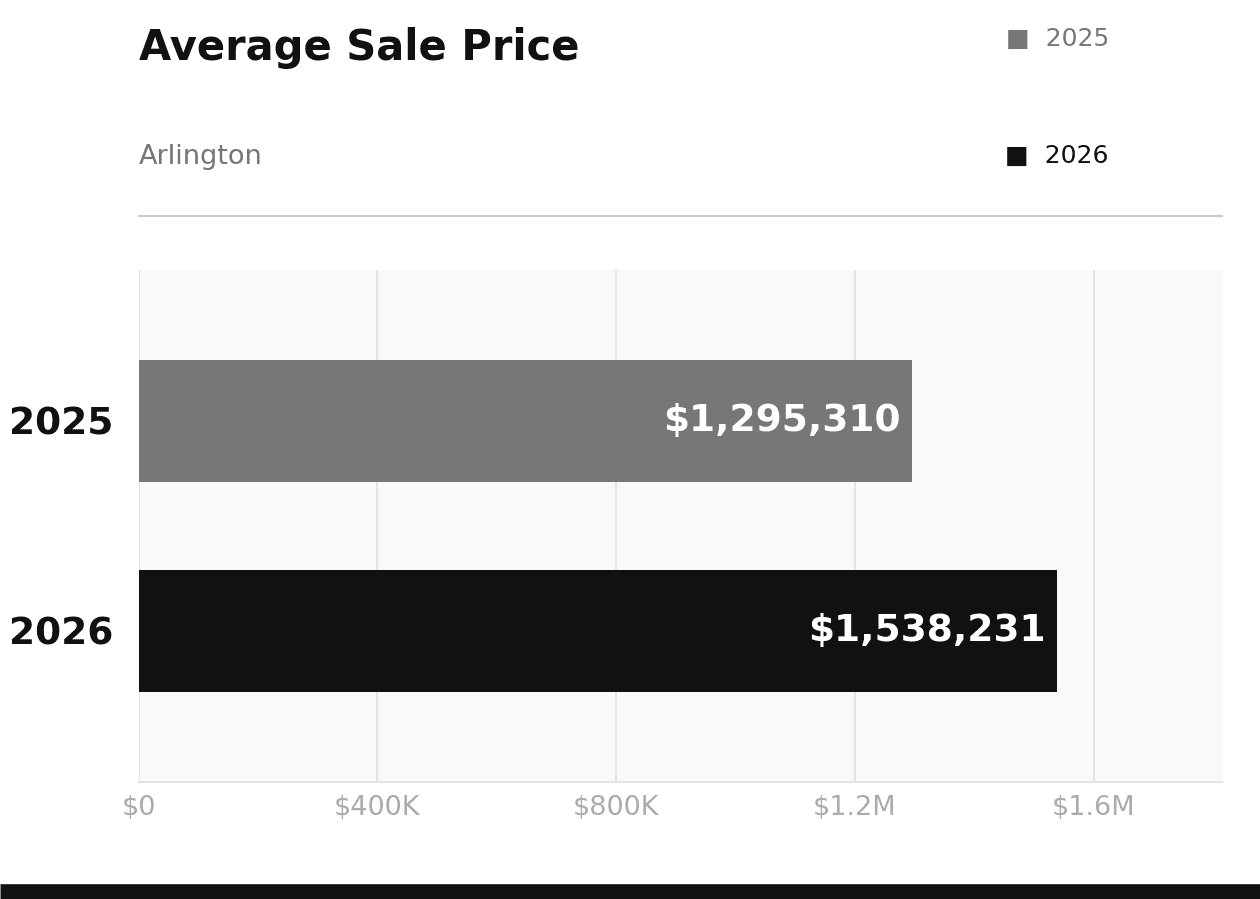
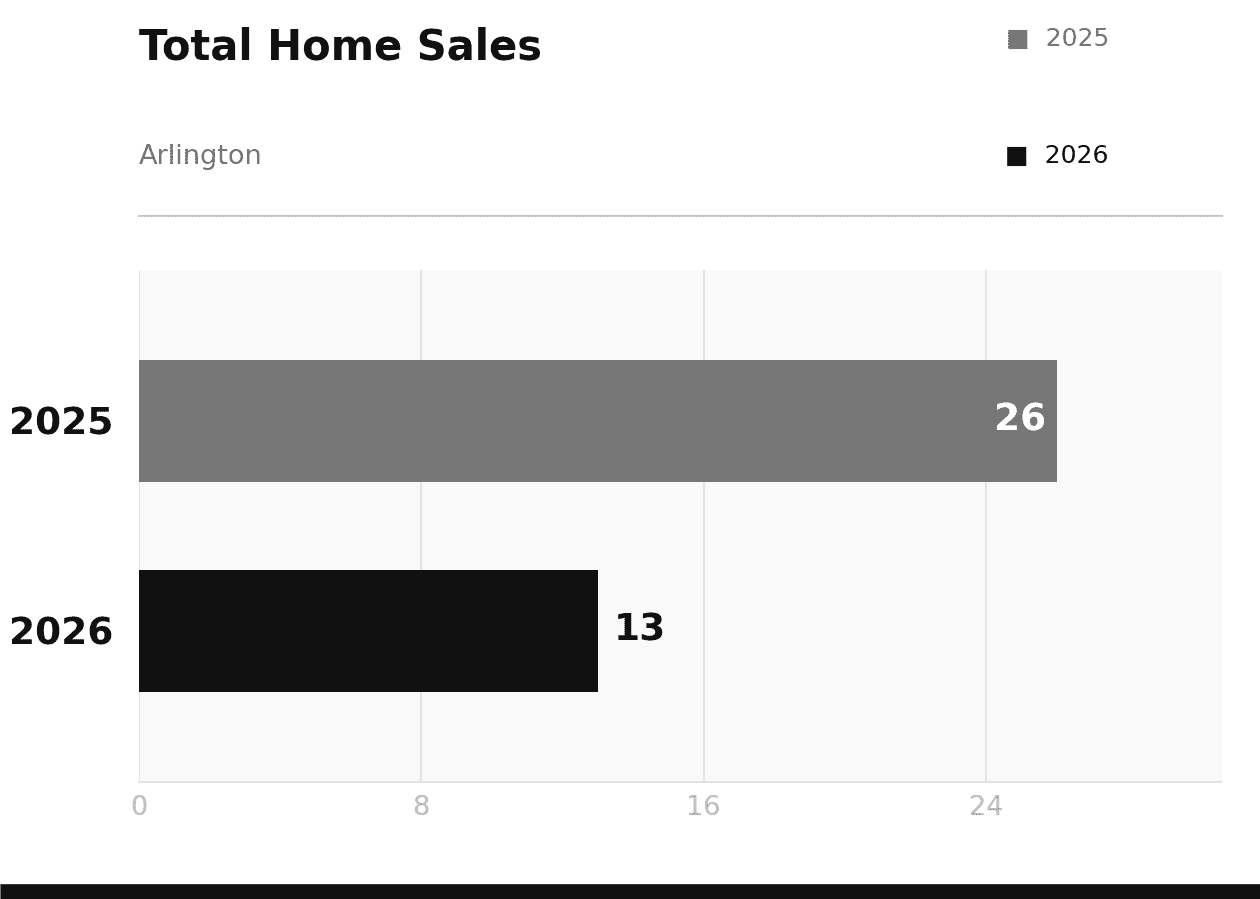
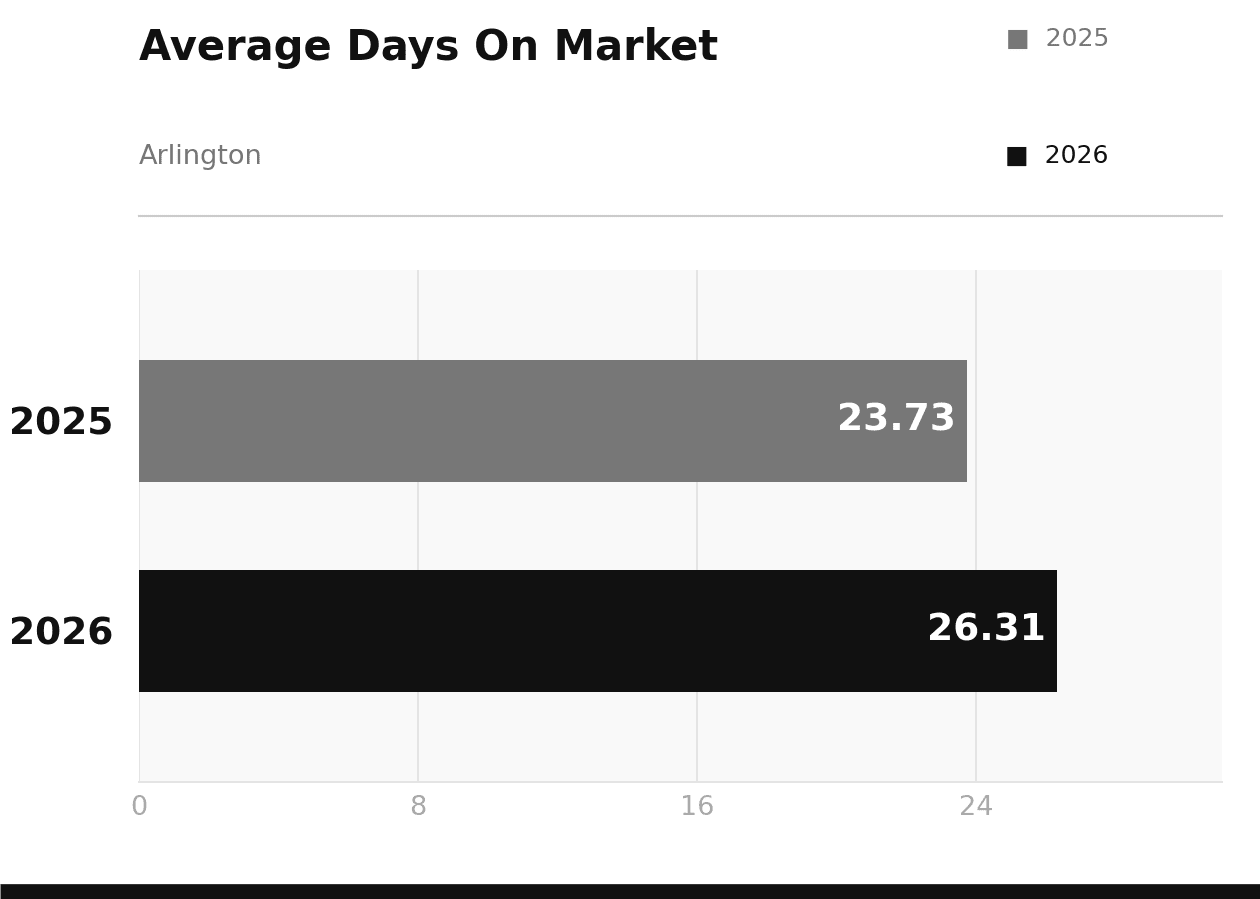
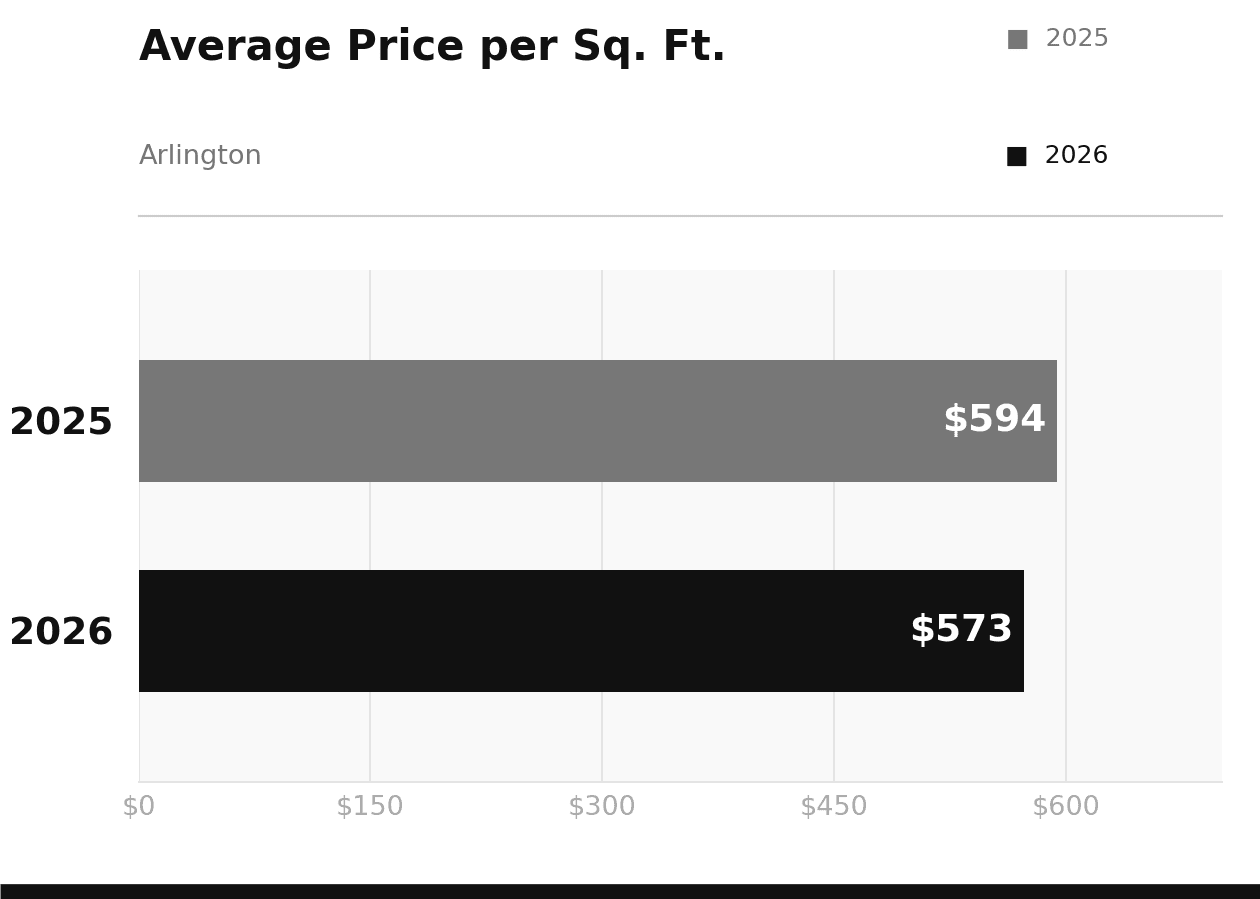
Arlington had the most striking average price move of the month. With 13 closings versus 26 in March 2025, volume was cut roughly in half, but average sale price jumped 19% from $1,295,310 to $1,538,231. That is a real price signal, not just a mix effect. Price per square foot dipped slightly from $594 to $573, which means the higher average prices were driven more by the type and size of homes that traded rather than across-the-board value appreciation. Days on market crept up just slightly from 23.73 to 26.31, still among the fastest in the region.
Arlington continues to attract buyers who want competitive pricing relative to Lexington and Winchester while staying close to Boston. The combination of higher average prices and fast days on market in March points to a market where motivated buyers are acting when the right home comes along.
What does this mean for your home?
Whether you are thinking about selling or simply keeping an eye on the market, Sven and the team are happy to walk you through what these numbers mean for your specific situation.