

January 31, 2026 | Market Reports
Real Estate Market Update | January 2026

January in the North of Boston real estate market brought a familiar mix: strong buyer interest in some towns, tighter inventory across the board, and price numbers that need a bit of context to read correctly. Here is a closer look at how Winchester, Lexington, and Arlington performed compared to January 2025.
Winchester
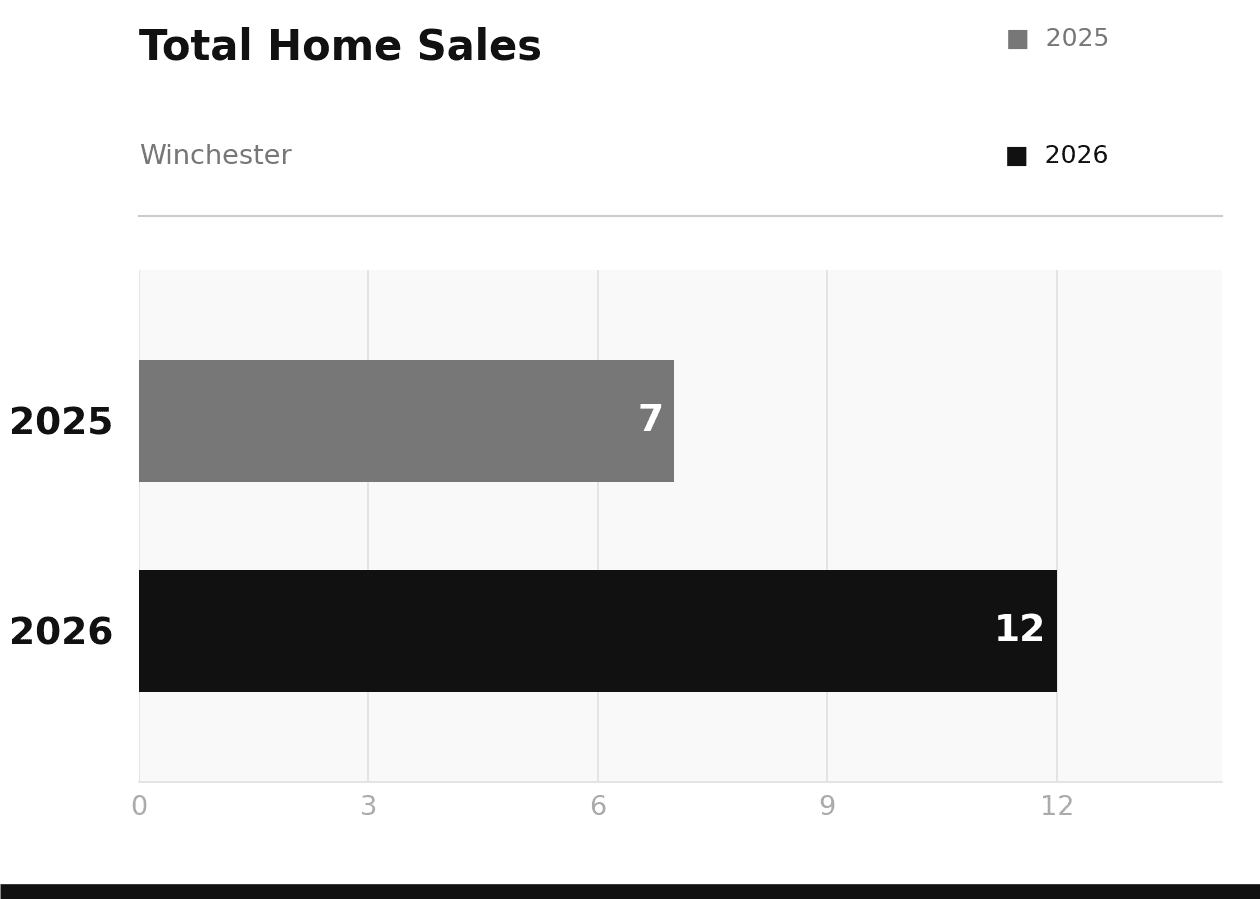
Winchester had one of its stronger January openings in recent memory. Twelve homes closed during the month, up from seven in January 2025, a 71% jump in volume. That kind of activity during the slower winter season reflects real demand from buyers who were ready to move.
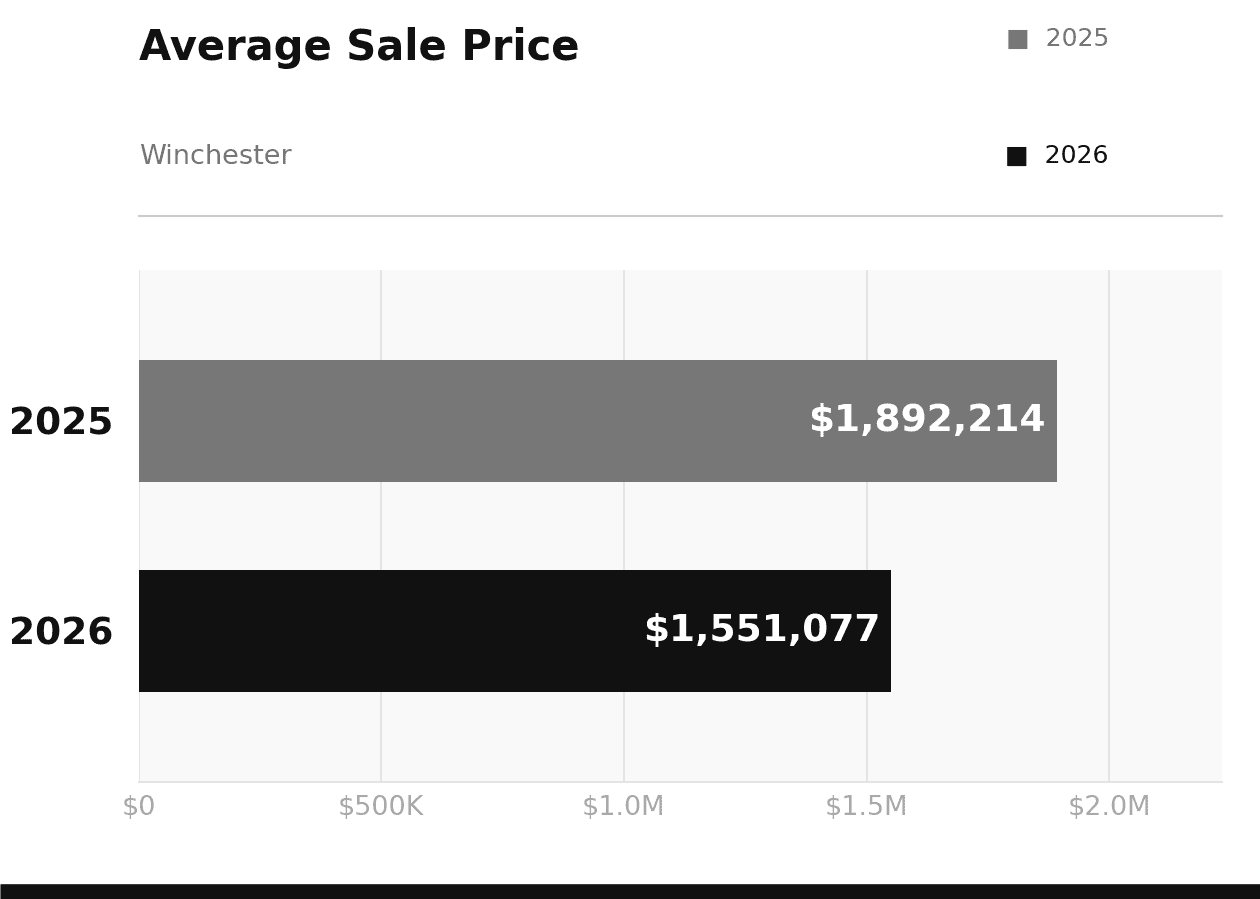
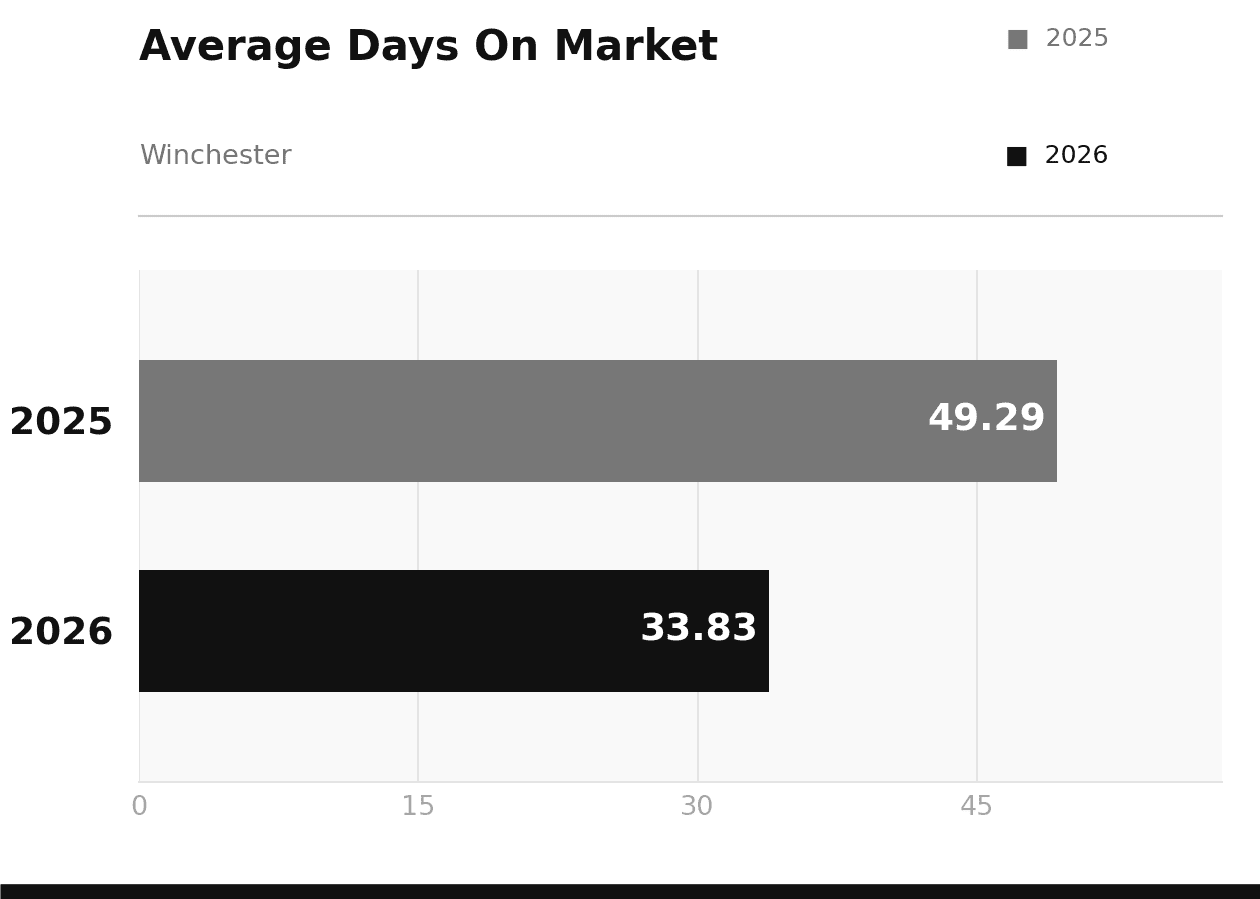
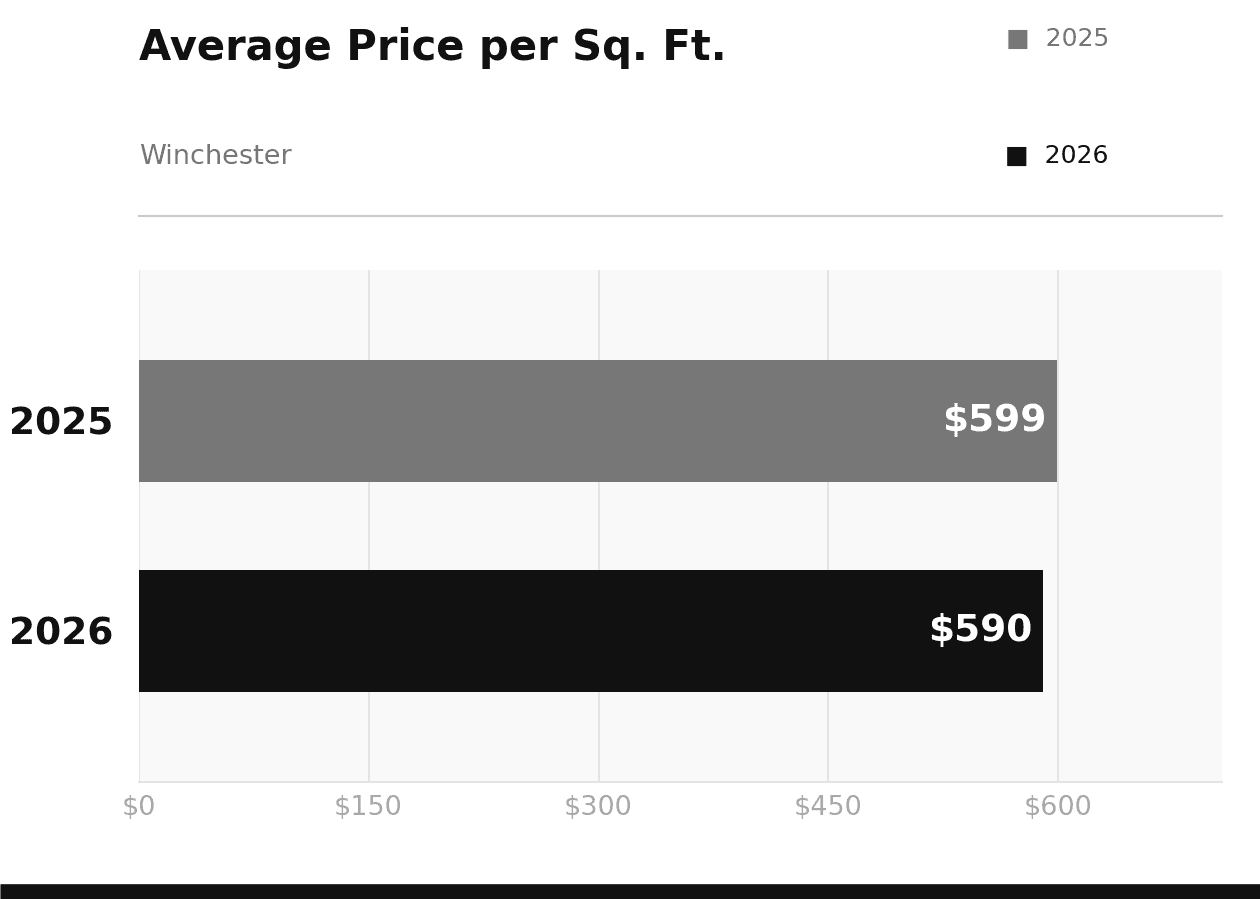
Homes also sold faster. Average days on market dropped from about 49 days to just under 34, which suggests buyers were not waiting around when a good property came up. Average price per square foot held nearly flat at $590 compared to $599 a year earlier, which tells a more stable story than the average sale price alone might suggest. The average sale price came in at $1,551,077 versus $1,892,214 in January 2025, but that gap reflects the mix of homes that closed this January rather than a broad market decline.
Lexington
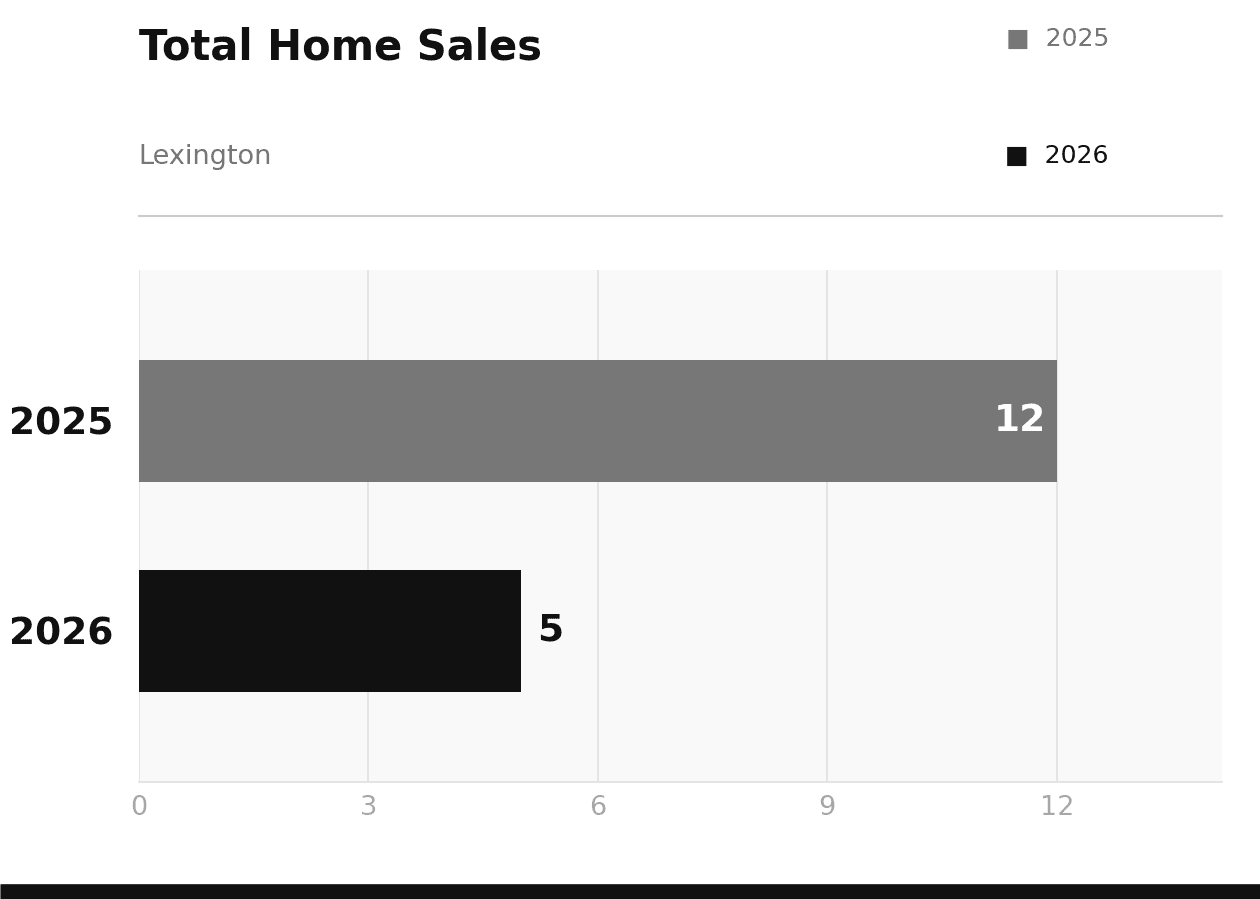
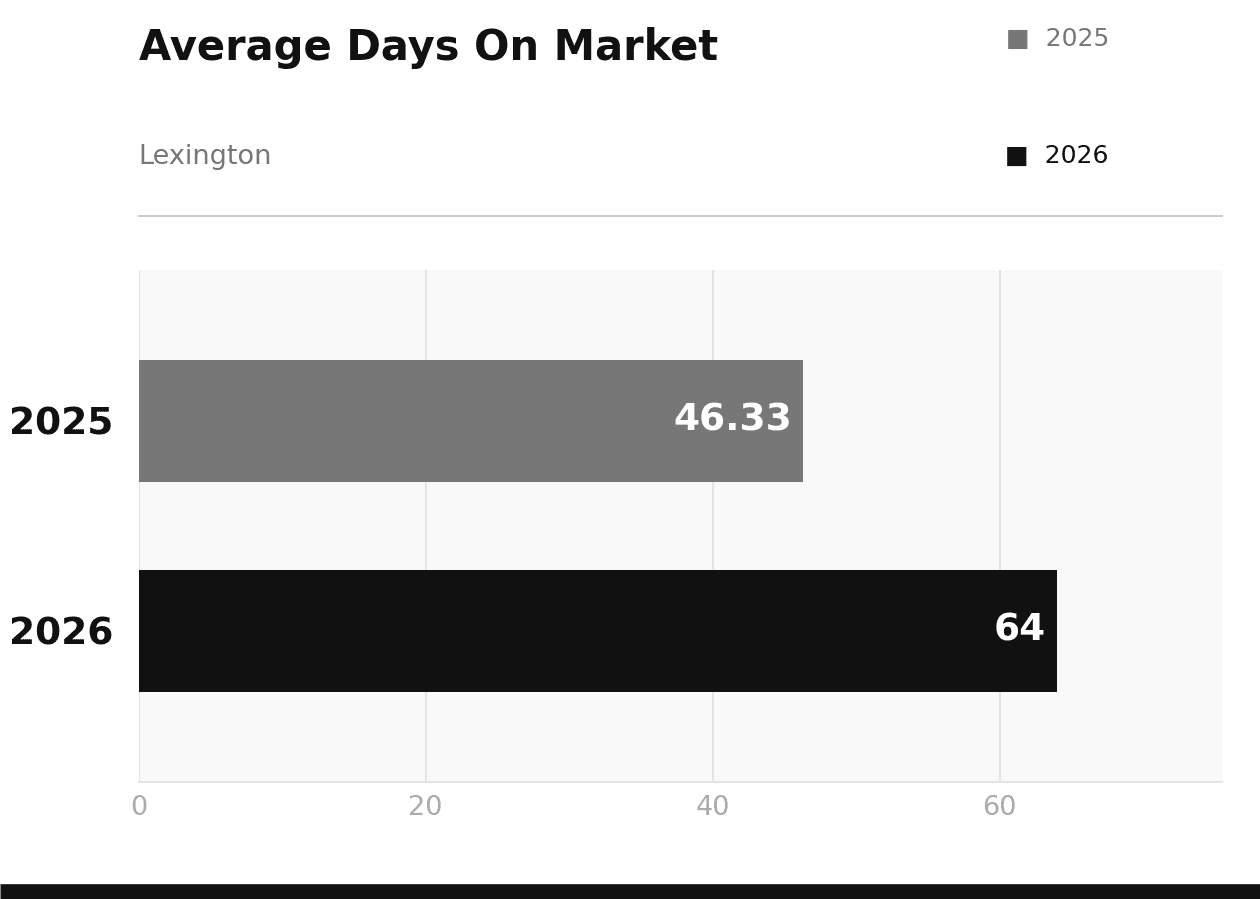
Lexington’s January was quieter on the volume side, with five closings compared to twelve in January 2025. Fewer homes coming to market in winter is typical for this town, and with less inventory to choose from, buyers and sellers spent more time negotiating. Average days on market rose from about 46 to 64.
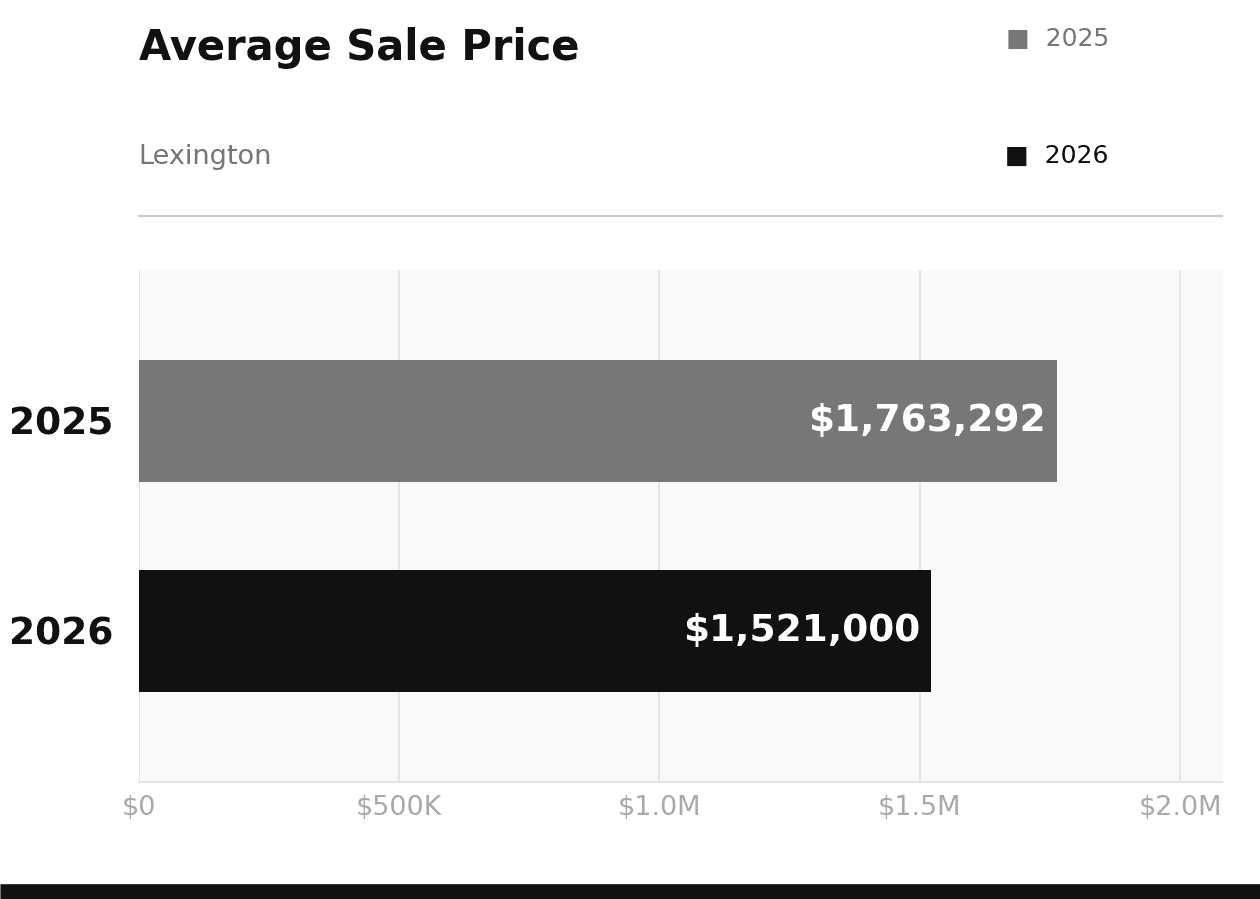
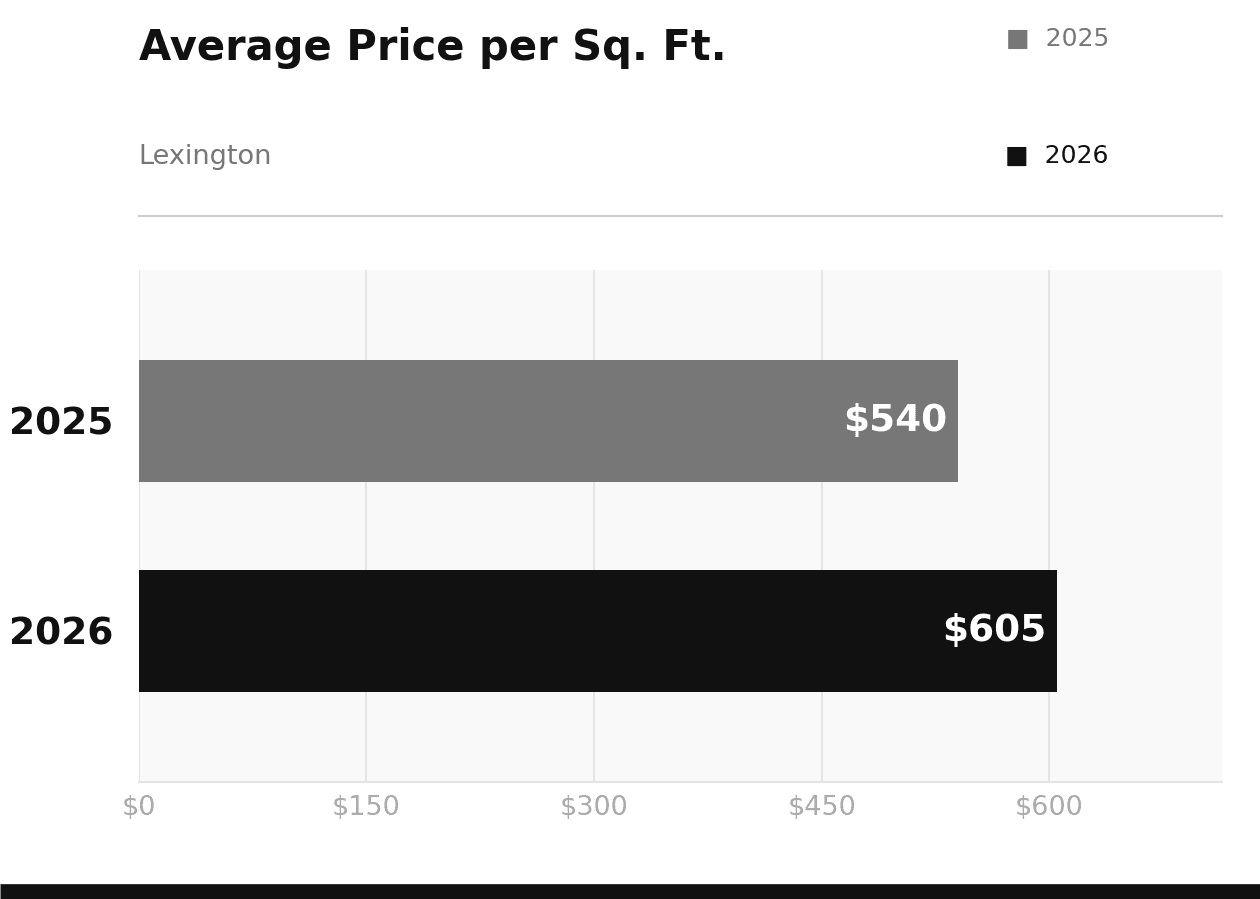
What stands out is price per square foot, which climbed from $540 to $605, a 12% increase. The homes that sold commanded a premium, pointing to strong underlying demand even when transaction counts are low. The average sale price of $1,521,000 compared to $1,763,292 a year ago is largely a function of which homes were available and closed, not a sign that Lexington values are pulling back.
Arlington
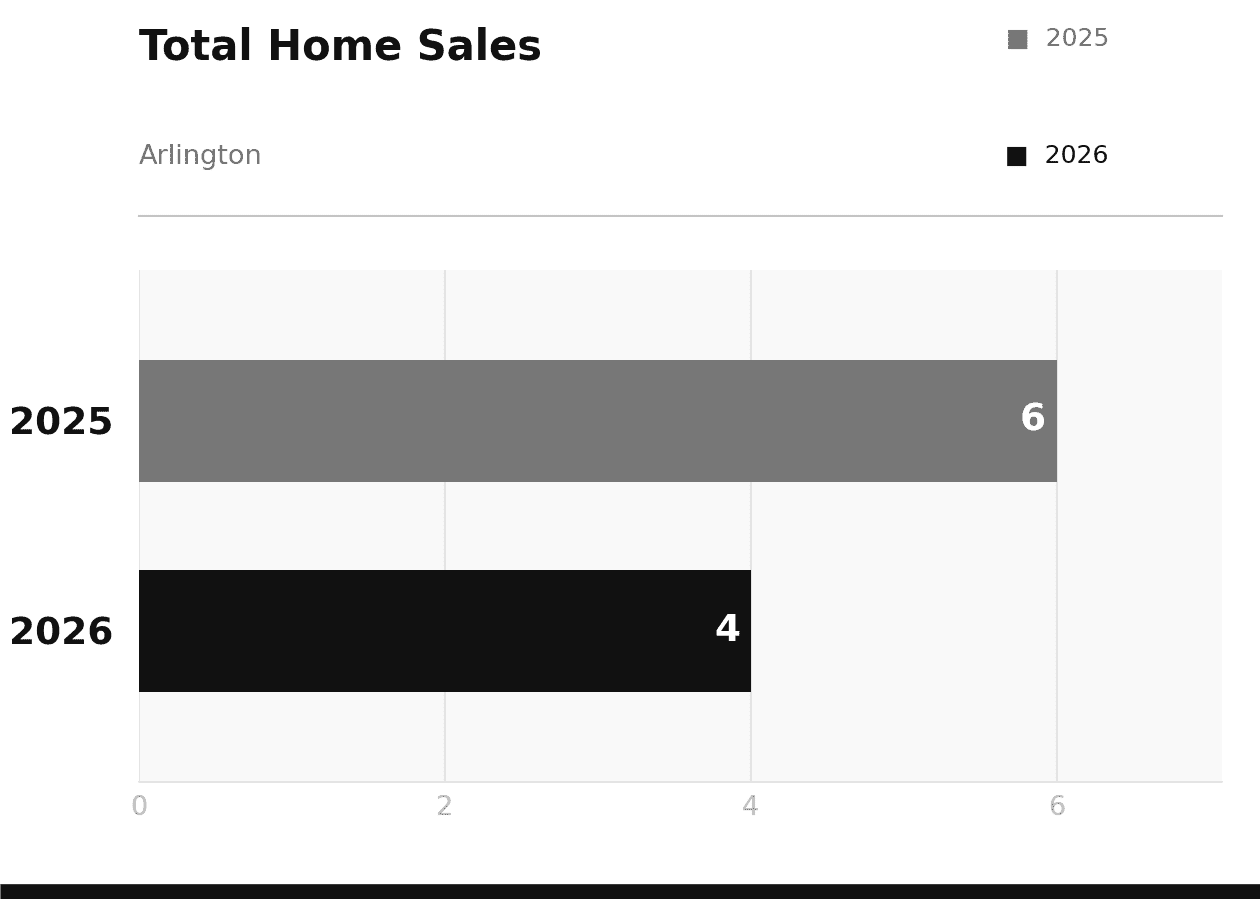
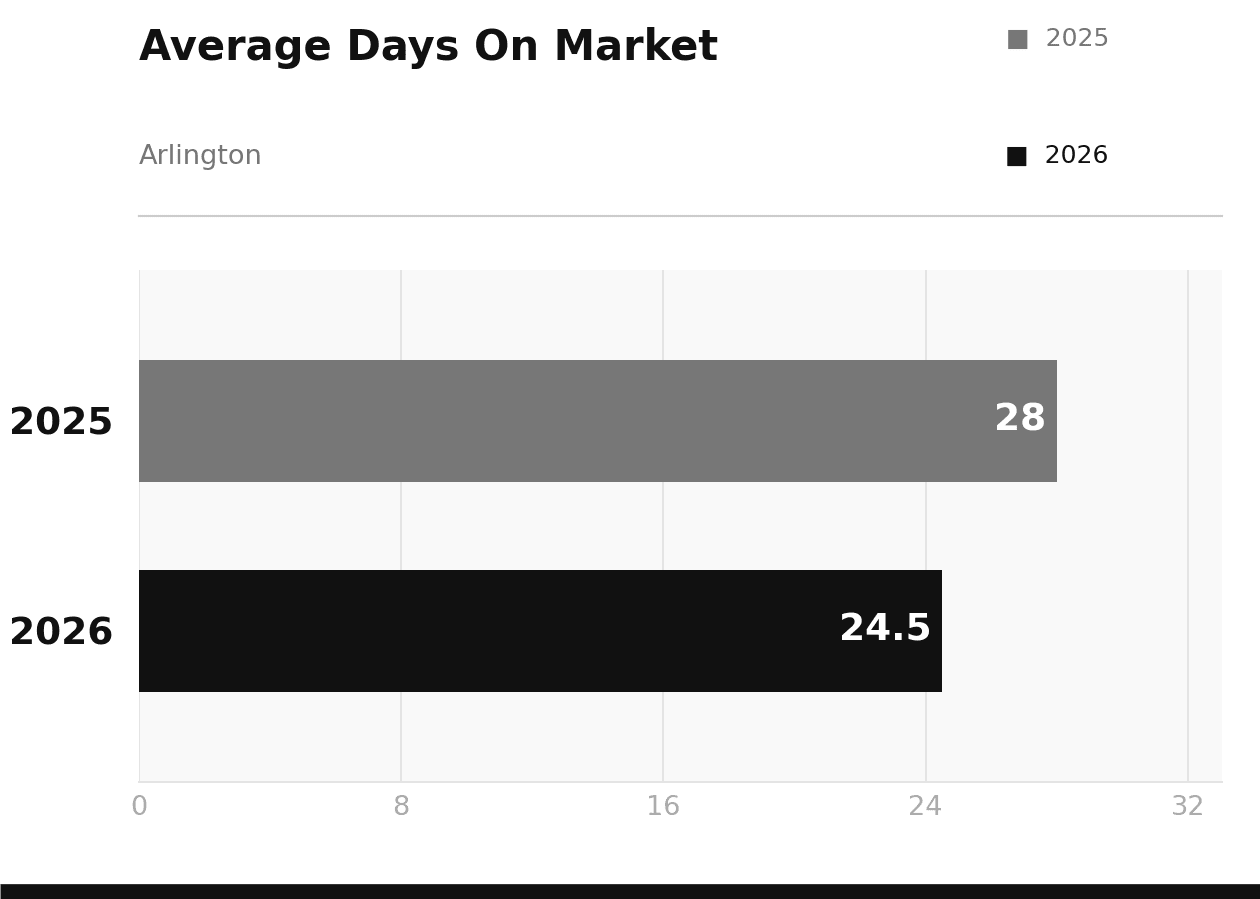
Arlington closed four transactions in January 2026 compared to six in January 2025. This is a thin market in any January, and the numbers reflect that. One positive note: average days on market came in at 24.5, a modest improvement from 28 days a year ago, so the homes that were priced right moved without lingering.
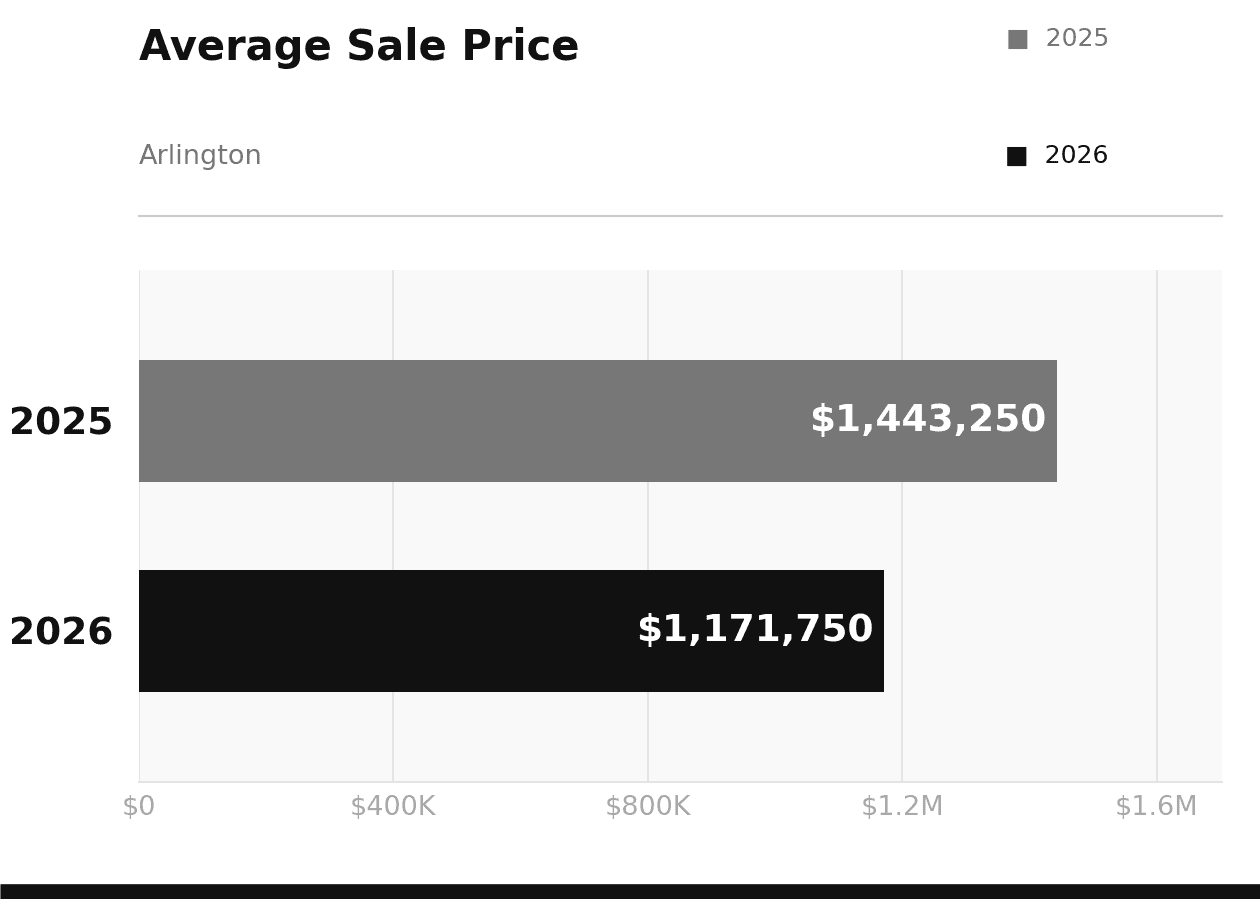
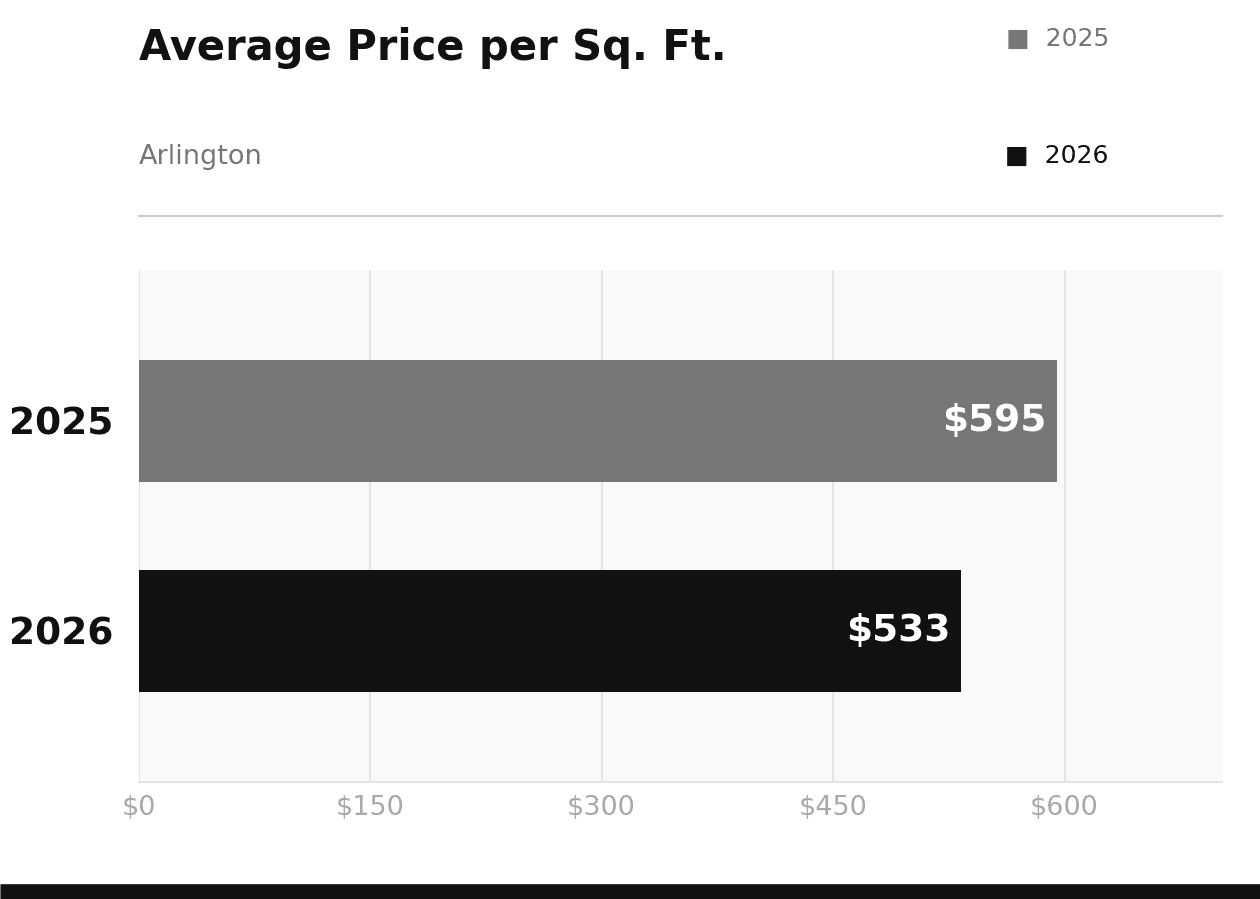
Average sale price came in at $1,171,750, down from $1,443,250 in January 2025. Price per square foot moved from $595 to $533. As with the other towns, a small sample size means these averages shift easily based on what closed in a given month. The core takeaway for Arlington is that buyer interest is there, but buyers are selective in the winter months and respond to accurate pricing.
What does this mean for your home?
Whether you are thinking about selling this fall or keeping an eye on the market, Sven and the team are happy to walk you through what these numbers mean for your specific situation.